## Line Chart: WebShop Success Rate
### Overview
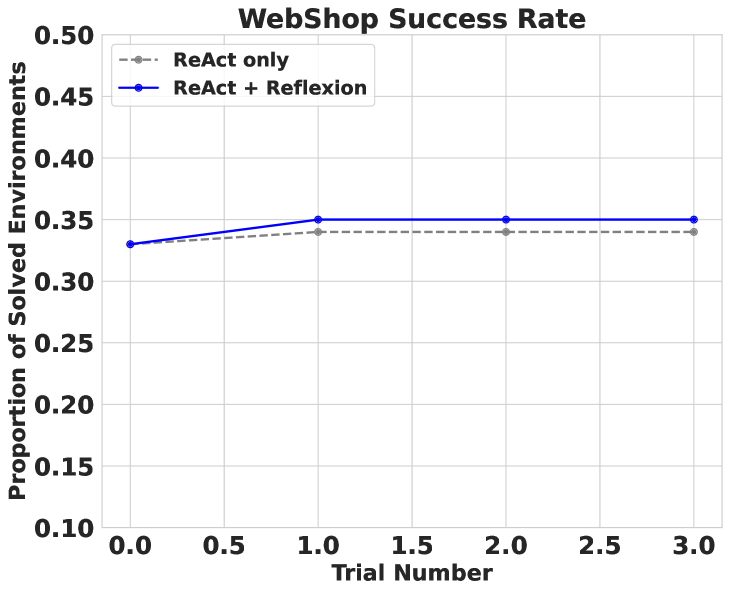
The image is a line chart comparing the success rate of two methods, "ReAct only" and "ReAct + Reflexion," across four trials (Trial Number 0 to 3). The y-axis represents the "Proportion of Solved Environments," ranging from 0.10 to 0.50.
### Components/Axes
* **Title:** WebShop Success Rate
* **X-axis:** Trial Number (0.0, 0.5, 1.0, 1.5, 2.0, 2.5, 3.0)
* **Y-axis:** Proportion of Solved Environments (0.10, 0.15, 0.20, 0.25, 0.30, 0.35, 0.40, 0.45, 0.50)
* **Legend:** Located in the top-left corner.
* ReAct only (gray dashed line with circular markers)
* ReAct + Reflexion (blue solid line with circular markers)
### Detailed Analysis
* **ReAct only (gray dashed line):** The success rate starts at approximately 0.33 at Trial 0, increases to approximately 0.34 at Trial 1, and remains relatively constant at approximately 0.34 for Trials 2 and 3.
* Trial 0: ~0.33
* Trial 1: ~0.34
* Trial 2: ~0.34
* Trial 3: ~0.34
* **ReAct + Reflexion (blue solid line):** The success rate starts at approximately 0.33 at Trial 0, increases to approximately 0.35 at Trial 1, and remains constant at approximately 0.35 for Trials 2 and 3.
* Trial 0: ~0.33
* Trial 1: ~0.35
* Trial 2: ~0.35
* Trial 3: ~0.35
### Key Observations
* The "ReAct + Reflexion" method consistently outperforms the "ReAct only" method, although the difference is small.
* Both methods show a slight increase in success rate from Trial 0 to Trial 1, after which the success rate plateaus.
### Interpretation
The data suggests that adding "Reflexion" to the "ReAct" method results in a slightly higher success rate in solving WebShop environments. The plateauing of the success rate after the first trial indicates that further trials do not significantly improve performance for either method. The difference between the two methods is small, suggesting that the impact of "Reflexion" is limited in this context.