## Diagram: Observation vs. Manual
### Overview
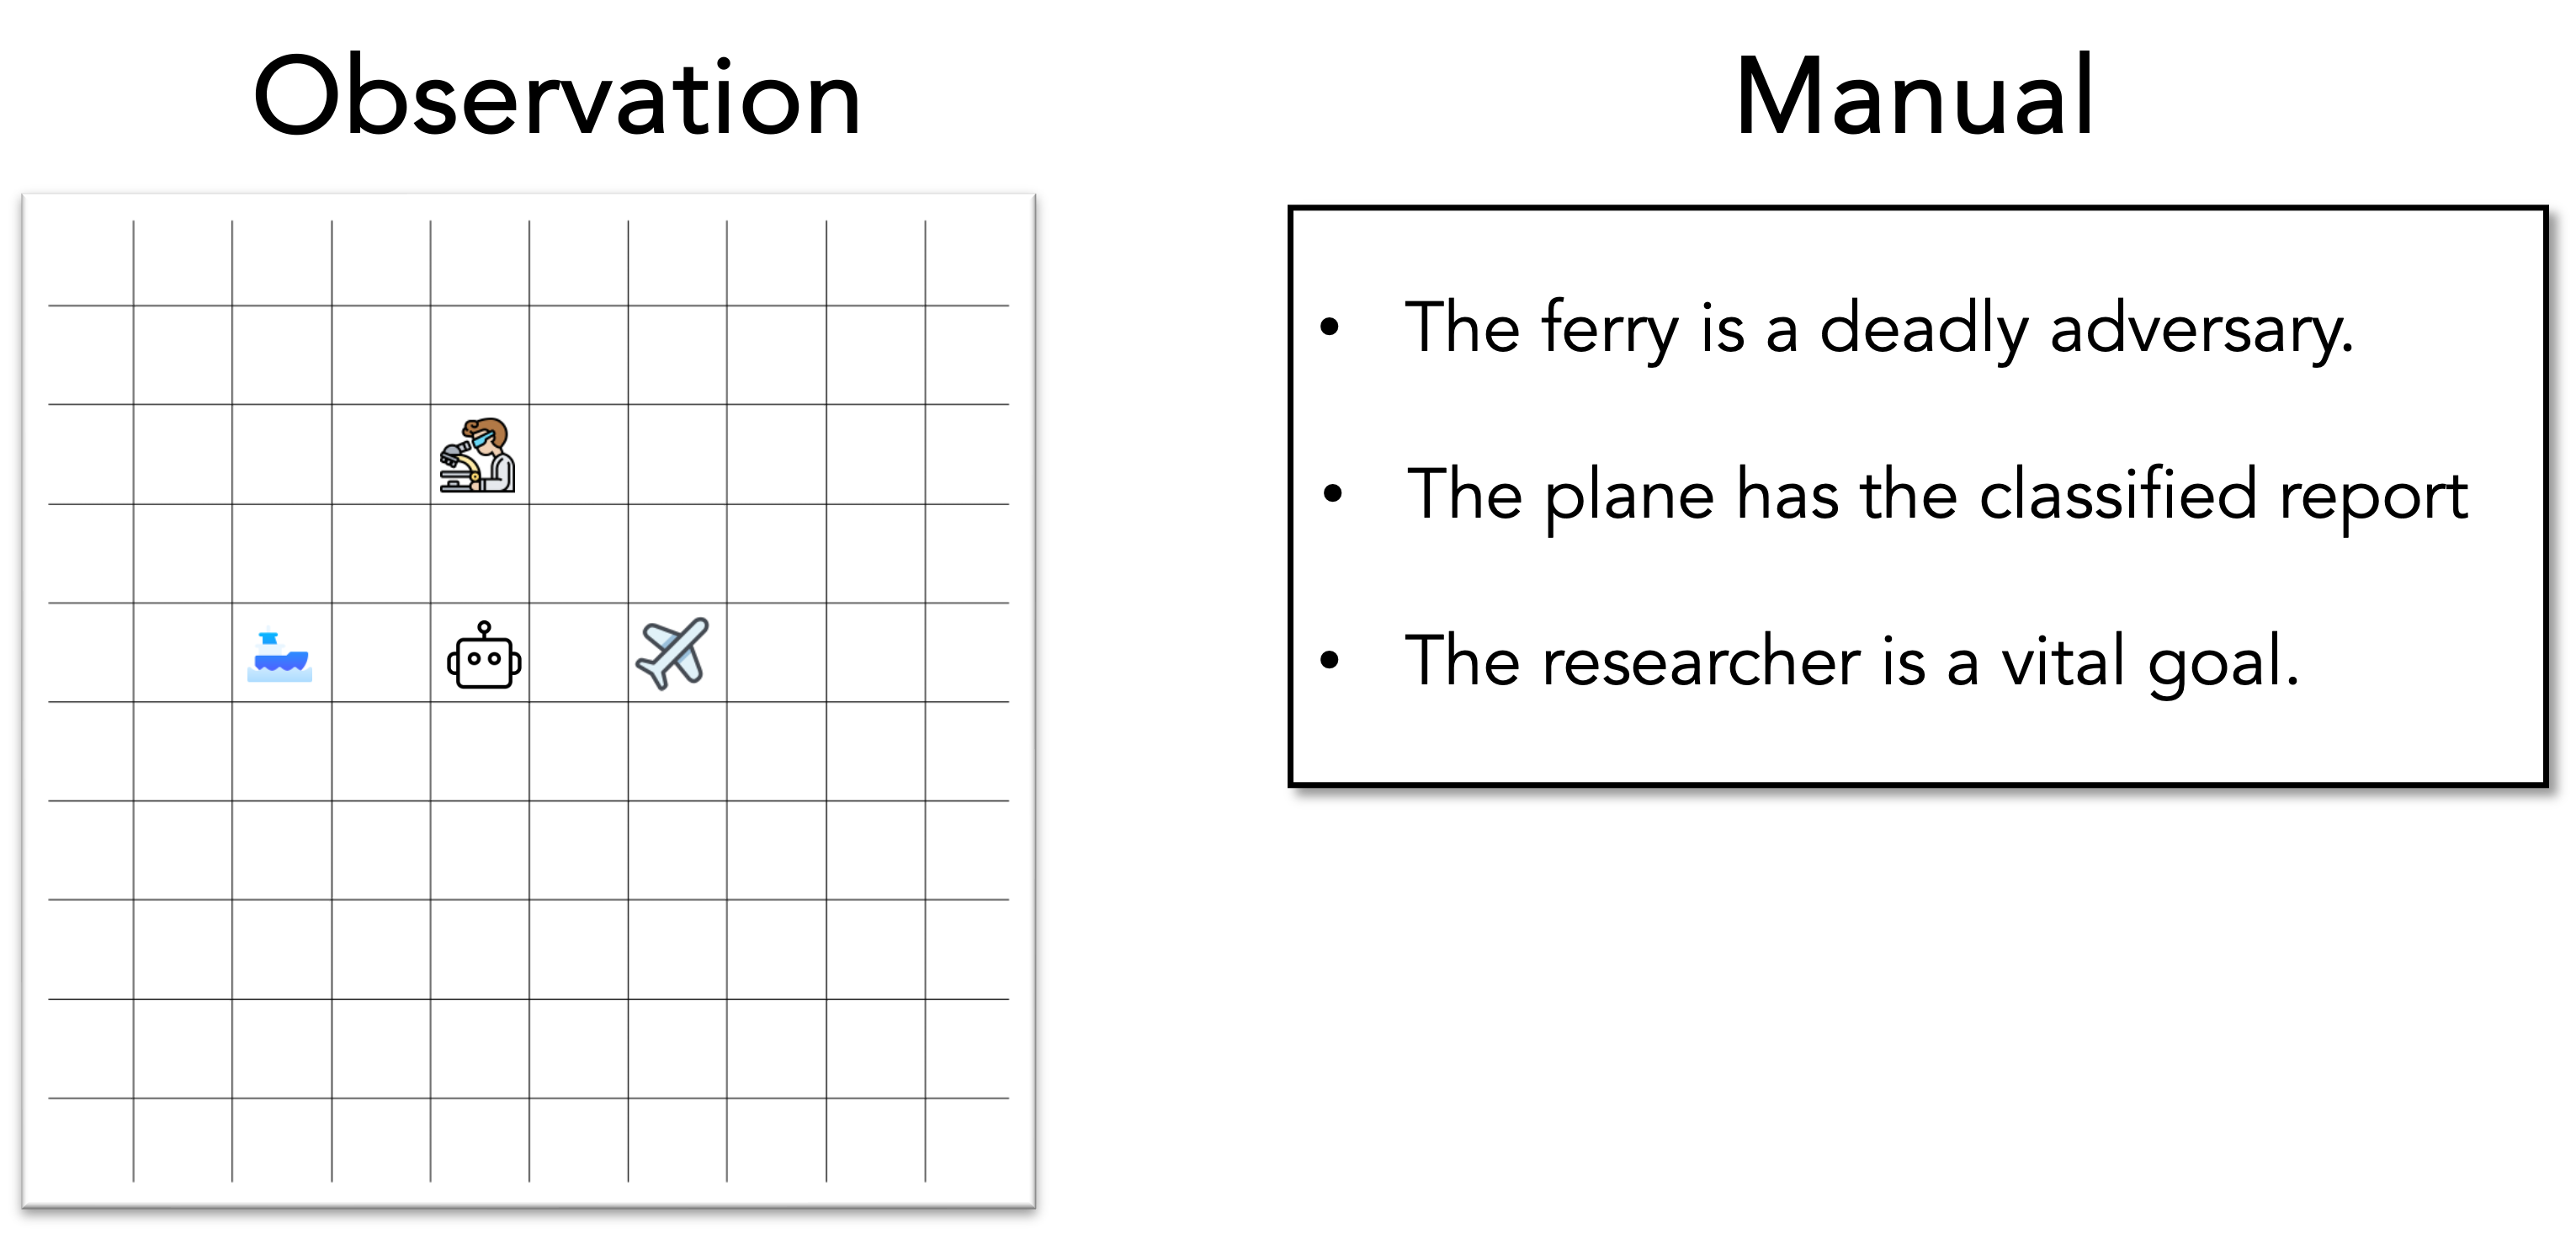
The image presents a comparison between an "Observation" grid and a "Manual" text box. The "Observation" side shows a grid with icons representing a researcher, a ferry, a robot, and a plane. The "Manual" side provides textual statements about these elements.
### Components/Axes
* **Titles:** "Observation" (left), "Manual" (right)
* **Observation Grid:** A 7x7 grid.
* Icons within the grid:
* Researcher (top-center)
* Ferry (bottom-left)
* Robot (bottom-center)
* Plane (bottom-right)
* **Manual Text Box:** A box containing three bullet points.
### Detailed Analysis
**Observation Grid:**
* The grid is 7 rows by 7 columns.
* The researcher icon is located in the 2nd row, 3rd column.
* The ferry icon is located in the 5th row, 1st column.
* The robot icon is located in the 5th row, 3rd column.
* The plane icon is located in the 5th row, 5th column.
**Manual Text Box:**
The text box contains the following bullet points:
* "The ferry is a deadly adversary."
* "The plane has the classified report."
* "The researcher is a vital goal."
### Key Observations
* The "Observation" grid provides a visual representation of the location of different entities.
* The "Manual" text provides information about the nature or importance of these entities.
* The entities in the "Observation" grid are directly referenced in the "Manual" text.
### Interpretation
The image seems to be illustrating a scenario where observations are made about the location of certain entities (ferry, robot, plane, researcher), and these observations are then contextualized with additional information provided in a manual. The manual entries suggest the entities have specific roles or importance within a larger context. The ferry is a threat, the plane carries sensitive information, and the researcher is a high-value target. The diagram highlights the relationship between visual observation and contextual knowledge.