\n
## Diagram: Observation & Manual
### Overview
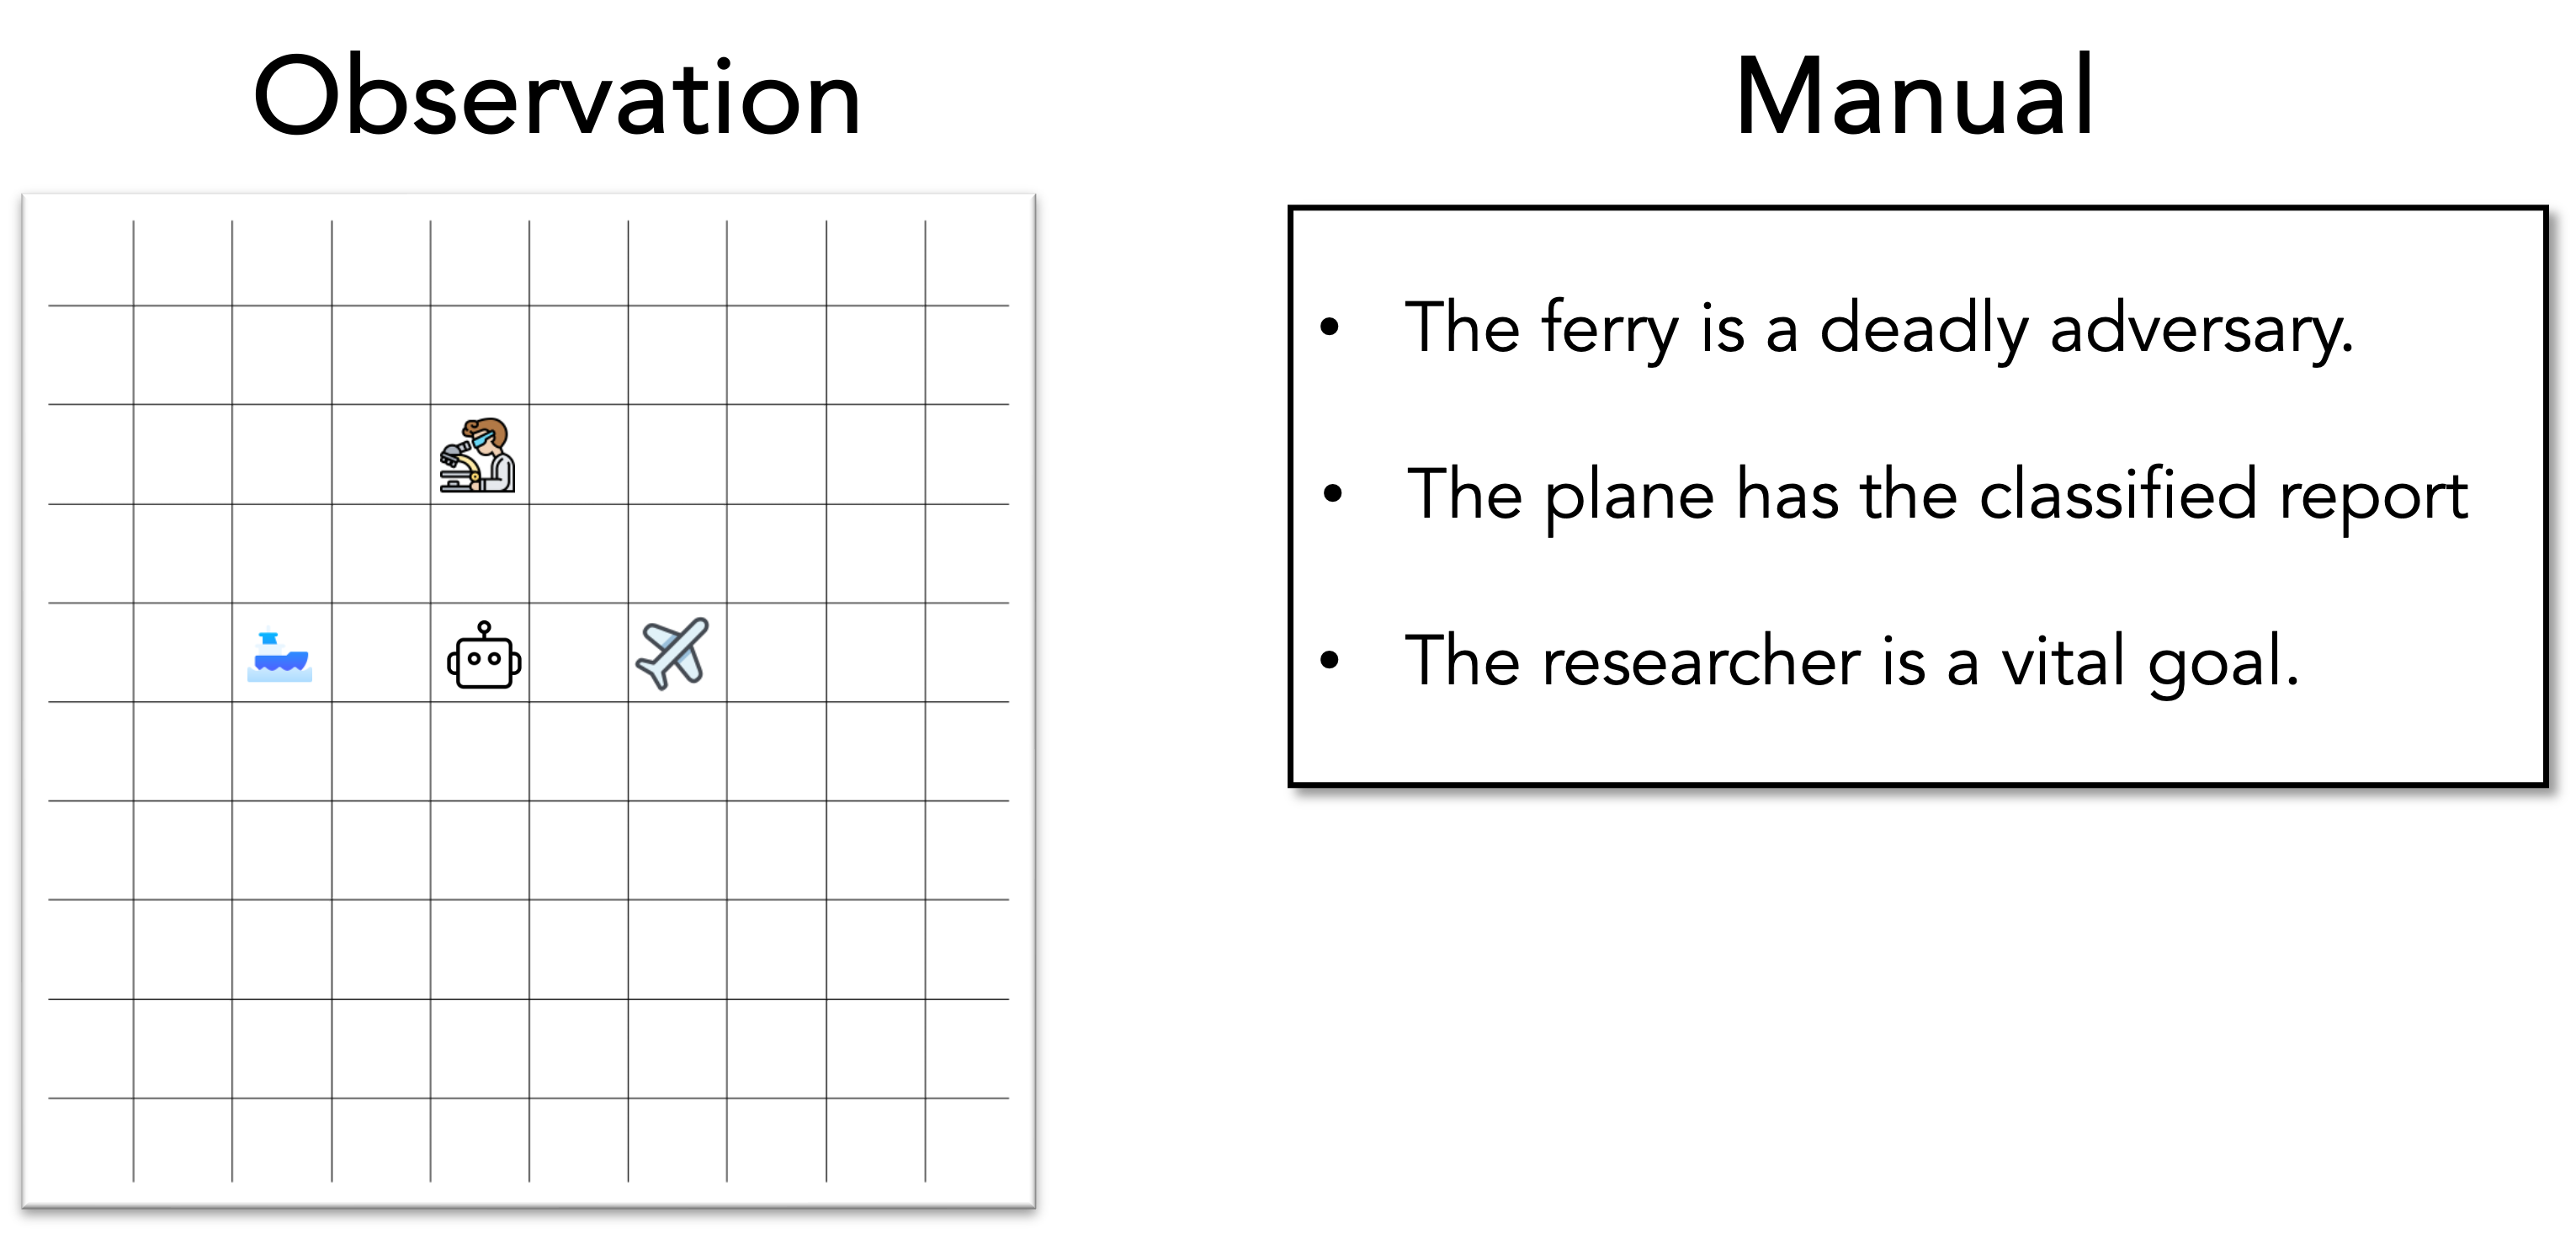
The image presents a two-part diagram. The left side depicts a grid with three icons arranged vertically. The right side contains a block of text labeled "Manual" with three bullet points. The overall impression is of a system or process involving observation and associated instructions.
### Components/Axes
The left side is a grid, approximately 10x10, with faint gray lines. The icons are positioned along the vertical center of the grid.
The right side has a title "Manual" in a larger font size. The text is formatted as a bulleted list.
### Detailed Analysis or Content Details
**Left Side - Grid & Icons:**
* **Icon 1 (Top):** A person seated at a desk with laboratory equipment (beakers, flasks).
* **Icon 2 (Middle):** A blue ferry boat.
* **Icon 3 (Bottom):** A pair of scissors.
**Right Side - Manual:**
* **Bullet Point 1:** "The ferry is a deadly adversary."
* **Bullet Point 2:** "The plane has the classified report"
* **Bullet Point 3:** "The researcher is a vital goal."
### Key Observations
The icons on the left appear to represent entities or objects being observed. The "Manual" on the right provides instructions or assessments related to these observed entities. The connection between the icons and the manual entries is not explicitly stated but is implied. The manual entries are declarative statements, suggesting a risk assessment or strategic context.
### Interpretation
The diagram suggests a system where observations are made (represented by the icons) and then interpreted or acted upon based on a set of instructions or knowledge (the "Manual"). The manual entries are somewhat cryptic, implying a potentially dangerous or sensitive situation. The ferry is identified as a threat ("deadly adversary"), the plane is a carrier of sensitive information ("classified report"), and the researcher is important ("vital goal"). This could represent a scenario involving espionage, security, or a high-stakes operation. The grid itself might represent a monitoring or tracking system. The lack of quantitative data suggests this is a qualitative assessment or a conceptual framework rather than a precise measurement. The diagram is more about establishing relationships and conveying a sense of context than presenting hard data.