## Line Chart: Token Span Analysis
### Overview
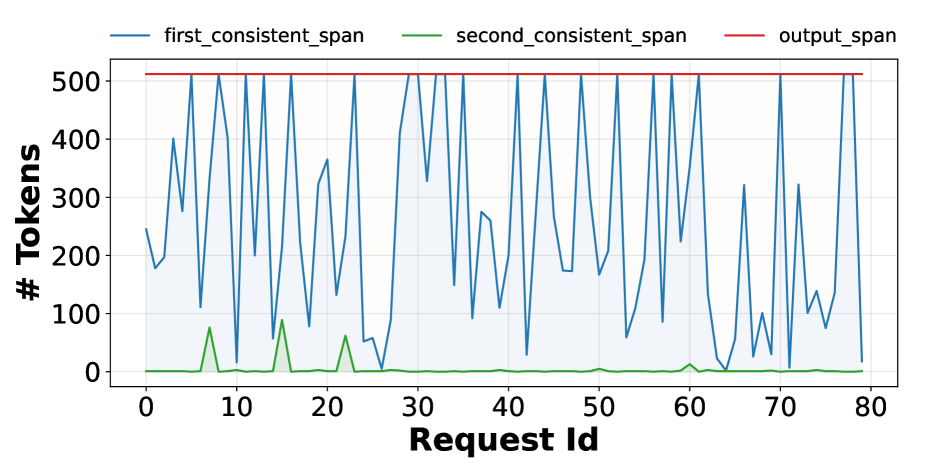
The image is a line chart comparing the number of tokens for 'first_consistent_span', 'second_consistent_span', and 'output_span' across different 'Request Ids'. The x-axis represents 'Request Id' ranging from 0 to 80, and the y-axis represents '# Tokens' ranging from 0 to 500.
### Components/Axes
* **X-axis:** 'Request Id', with tick marks at intervals of 10, ranging from 0 to 80.
* **Y-axis:** '# Tokens', with tick marks at intervals of 100, ranging from 0 to 500.
* **Legend:** Located at the top of the chart, indicating:
* 'first_consistent_span' (blue line)
* 'second_consistent_span' (green line)
* 'output_span' (red line)
### Detailed Analysis
* **first_consistent_span (blue line):** This line shows significant fluctuations across different 'Request Ids'. The values range approximately from 20 to 520. The area under the curve is shaded light blue.
* At Request Id 2, the value is approximately 240 tokens.
* At Request Id 5, the value drops to approximately 180 tokens.
* At Request Id 10, the value rises to approximately 510 tokens.
* At Request Id 25, the value drops to approximately 50 tokens.
* At Request Id 35, the value rises to approximately 520 tokens.
* At Request Id 45, the value drops to approximately 180 tokens.
* At Request Id 55, the value rises to approximately 520 tokens.
* At Request Id 65, the value drops to approximately 100 tokens.
* At Request Id 75, the value rises to approximately 200 tokens.
* **second_consistent_span (green line):** This line remains consistently low, close to 0 tokens, with a few spikes.
* At Request Id 12, the value is approximately 80 tokens.
* At Request Id 20, the value is approximately 60 tokens.
* At Request Id 60, the value is approximately 20 tokens.
* **output_span (red line):** This line remains constant at approximately 510 tokens across all 'Request Ids'.
### Key Observations
* The 'first_consistent_span' exhibits high variability in the number of tokens, while 'output_span' remains constant.
* The 'second_consistent_span' generally stays near zero, with occasional spikes.
### Interpretation
The chart illustrates the token usage for different spans across a series of requests. The 'output_span' consistently uses a fixed number of tokens (approximately 510), suggesting a fixed output size. The 'first_consistent_span' shows variable token usage, indicating that the number of tokens required for the first consistent span changes significantly with different requests. The 'second_consistent_span' uses very few tokens, suggesting it plays a minor role in the overall process. The variability in 'first_consistent_span' could be due to the complexity or length of the input requests.