\n
## Line Chart: Token Span Lengths vs. Request ID
### Overview
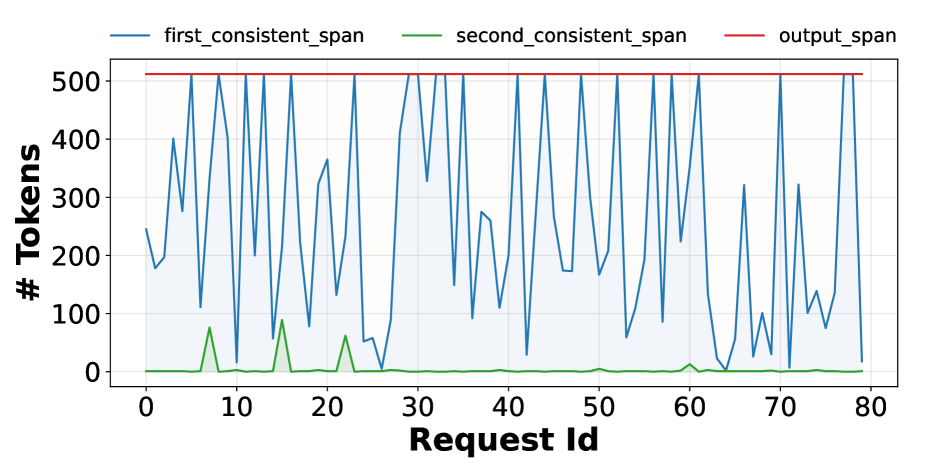
The image presents a line chart illustrating the relationship between Request ID and the number of tokens for three different spans: `first_consistent_span`, `second_consistent_span`, and `output_span`. The chart appears to track token lengths across 80 requests.
### Components/Axes
* **X-axis:** Labeled "Request Id", ranging from approximately 0 to 80.
* **Y-axis:** Labeled "# Tokens", ranging from approximately 0 to 500.
* **Legend:** Located at the top-center of the chart, identifying three data series:
* `first_consistent_span` (Blue line)
* `second_consistent_span` (Green line)
* `output_span` (Red line)
### Detailed Analysis
* **first_consistent_span (Blue Line):** This line exhibits a highly oscillatory pattern, fluctuating significantly between approximately 150 and 480 tokens. The trend is generally downward from Request ID 0 to approximately Request ID 75, then increases sharply at Request ID 80.
* At Request ID 0, the value is approximately 420 tokens.
* At Request ID 10, the value is approximately 450 tokens.
* At Request ID 20, the value is approximately 460 tokens.
* At Request ID 30, the value is approximately 60 tokens.
* At Request ID 40, the value is approximately 480 tokens.
* At Request ID 50, the value is approximately 180 tokens.
* At Request ID 60, the value is approximately 250 tokens.
* At Request ID 70, the value is approximately 80 tokens.
* At Request ID 80, the value is approximately 160 tokens.
* **second_consistent_span (Green Line):** This line remains consistently low, generally between 0 and 30 tokens. It shows minor fluctuations, with a peak around Request ID 10 at approximately 25 tokens. The trend is relatively flat.
* At Request ID 0, the value is approximately 0 tokens.
* At Request ID 10, the value is approximately 25 tokens.
* At Request ID 20, the value is approximately 10 tokens.
* At Request ID 30, the value is approximately 5 tokens.
* At Request ID 40, the value is approximately 15 tokens.
* At Request ID 50, the value is approximately 5 tokens.
* At Request ID 60, the value is approximately 10 tokens.
* At Request ID 70, the value is approximately 0 tokens.
* At Request ID 80, the value is approximately 5 tokens.
* **output_span (Red Line):** This line is a horizontal line at approximately 500 tokens throughout the entire range of Request IDs. It does not fluctuate.
### Key Observations
* The `first_consistent_span` exhibits the most significant variability in token length.
* The `second_consistent_span` consistently has a very low token count.
* The `output_span` maintains a constant token count.
* There is a clear difference in scale between the `first_consistent_span` and the other two spans.
### Interpretation
The chart likely represents the token lengths of different components within a processing pipeline for 80 requests. The `first_consistent_span` could represent the input text or a primary processing stage, explaining its large and variable token count. The `second_consistent_span` might represent a filtered or summarized version of the input, resulting in a much smaller and stable token count. The `output_span` being constant suggests a fixed-length output format or a padding mechanism. The fluctuations in the `first_consistent_span` could be due to variations in the input text length or complexity. The sharp increase at Request ID 80 is an outlier and warrants further investigation. The consistent low value of the `second_consistent_span` suggests it is a consistently small component of the overall process. The constant value of the `output_span` suggests a fixed output size.