## Line Chart: Token Counts Across Request IDs
### Overview
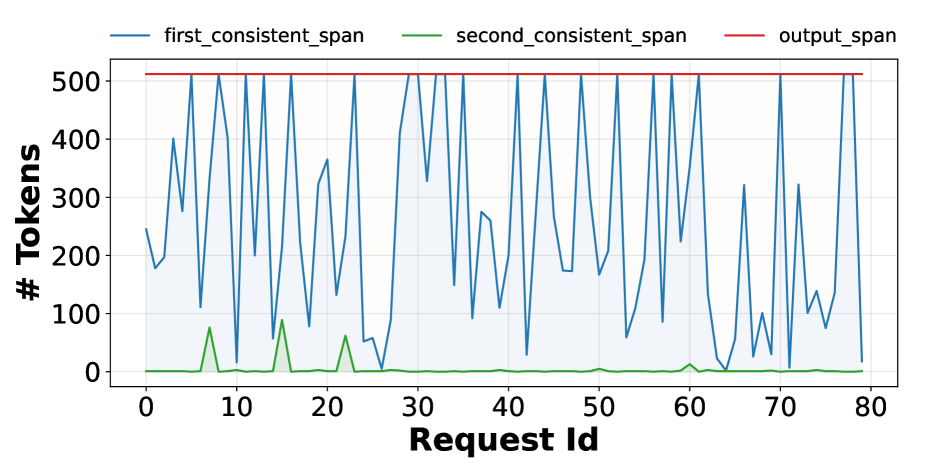
The image displays a line chart plotting the number of tokens against a sequence of Request IDs. It compares three distinct data series: `first_consistent_span`, `second_consistent_span`, and `output_span`. The chart reveals a stark contrast between a highly variable series, a mostly dormant series, and a constant series.
### Components/Axes
* **Chart Type:** Multi-line chart.
* **X-Axis:**
* **Label:** `Request Id`
* **Scale:** Linear, ranging from 0 to 80.
* **Major Ticks:** Marked at intervals of 10 (0, 10, 20, 30, 40, 50, 60, 70, 80).
* **Y-Axis:**
* **Label:** `# Tokens`
* **Scale:** Linear, ranging from 0 to 500.
* **Major Ticks:** Marked at intervals of 100 (0, 100, 200, 300, 400, 500).
* **Legend:**
* **Position:** Top center, above the plot area.
* **Series:**
1. `first_consistent_span` - Represented by a **blue** line.
2. `second_consistent_span` - Represented by a **green** line.
3. `output_span` - Represented by a **red** line.
### Detailed Analysis
**1. `output_span` (Red Line):**
* **Trend:** Perfectly horizontal, constant.
* **Value:** Maintains a steady value of approximately **510 tokens** across all Request IDs from 0 to 80. This line sits just above the 500-token grid line.
**2. `first_consistent_span` (Blue Line):**
* **Trend:** Highly volatile and erratic. The line exhibits frequent, sharp peaks and deep troughs throughout the entire range.
* **Data Points (Approximate):**
* Starts at ~240 tokens (Request Id 0).
* Shows significant peaks reaching or exceeding 500 tokens at multiple points (e.g., near Request Ids 8, 12, 28, 32, 42, 48, 58, 78).
* Drops to very low values, often below 50 tokens, at many points (e.g., near Request Ids 10, 20, 26, 40, 50, 62, 70).
* The pattern is non-cyclical and shows no clear upward or downward trend over the full range; it is characterized by high-frequency, high-amplitude noise.
**3. `second_consistent_span` (Green Line):**
* **Trend:** Mostly flat and near zero, with a few isolated, small spikes.
* **Data Points (Approximate):**
* Remains at or very close to **0 tokens** for the vast majority of Request IDs.
* Notable small spikes occur at approximately:
* Request Id ~5: Peaks at ~75 tokens.
* Request Id ~15: Peaks at ~85 tokens.
* Request Id ~22: Peaks at ~60 tokens.
* Request Id ~60: A very minor bump to ~10 tokens.
### Key Observations
1. **Fixed Output:** The `output_span` is invariant, suggesting a fixed-length output or a capped value for all requests in this dataset.
2. **High Variance in Primary Input:** The `first_consistent_span` shows extreme variability, indicating that the primary input or context length for these requests is highly inconsistent.
3. **Minimal Secondary Input:** The `second_consistent_span` is negligible for most requests, implying it is either not used, is very short, or is only relevant for a small subset of requests (those with the spikes).
4. **No Correlation Visibly Apparent:** There is no obvious visual correlation between the spikes in the green line and the peaks or troughs of the blue line.
### Interpretation
This chart likely visualizes token usage statistics for a series of API calls or processing tasks (identified by `Request Id`). The data suggests a system where:
* The **output** is standardized (`output_span` constant at ~510 tokens).
* The **primary input or context** (`first_consistent_span`) is the main driver of variability in the system's load, fluctuating wildly between very short and very long sequences.
* A **secondary input or context** (`second_consistent_span`) plays a minimal role, only appearing significantly in a handful of requests (around IDs 5, 15, 22).
The key takeaway is the system's handling of highly variable input lengths while producing a fixed-length output. The spikes in the green line could represent special cases, error conditions, or a different mode of operation for those specific requests. The lack of correlation between the blue and green lines suggests these two "consistent spans" are independent components of the request.