## Line Chart: Token Counts Across Request IDs
### Overview
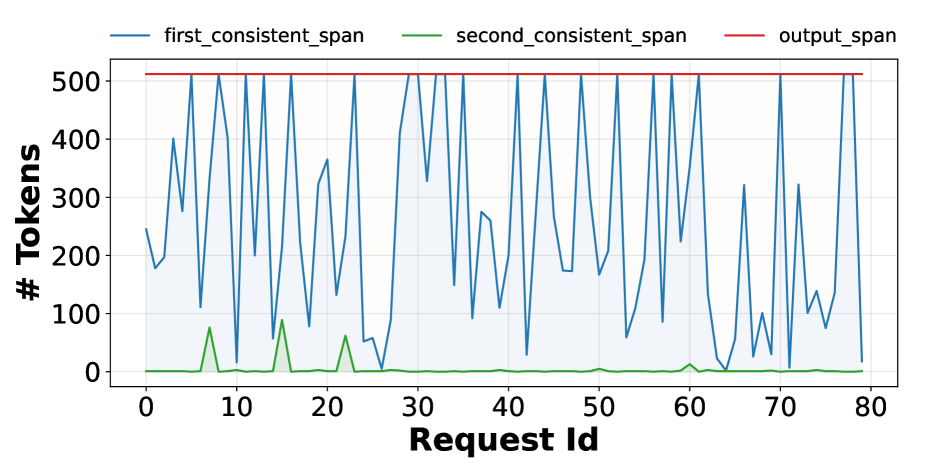
The chart displays three data series tracking token counts across 81 request IDs (0–80). The y-axis represents token counts (0–500), while the x-axis represents sequential request IDs. Three lines are plotted:
- **Blue (first_consistent_span)**: Dominates the chart with high-frequency oscillations.
- **Green (second_consistent_span)**: Shows two distinct peaks.
- **Red (output_span)**: A flat line at the maximum y-axis value (500).
### Components/Axes
- **X-axis (Request Id)**: Labeled "Request Id," ranging from 0 to 80 in increments of 10.
- **Y-axis (# Tokens)**: Labeled "# Tokens," ranging from 0 to 500 in increments of 100.
- **Legend**: Positioned at the top, with colors mapped as:
- Blue → `first_consistent_span`
- Green → `second_consistent_span`
- Red → `output_span`
### Detailed Analysis
1. **Red Line (output_span)**:
- Constant at **500 tokens** across all request IDs.
- No variation observed; acts as a ceiling for other series.
2. **Blue Line (first_consistent_span)**:
- Oscillates between **~100–500 tokens** with sharp peaks and troughs.
- Notable patterns:
- Peaks near request IDs 5, 15, 25, 35, 45, 55, 65, 75.
- Troughs near request IDs 10, 20, 30, 40, 50, 60, 70.
- Shaded area under the line suggests variability in token counts.
3. **Green Line (second_consistent_span)**:
- Remains near **0 tokens** for most request IDs.
- Two prominent peaks:
- First peak at request ID **~10**, reaching ~100 tokens.
- Second peak at request ID **~20**, reaching ~80 tokens.
- Sharp decline after peaks; no further activity observed.
### Key Observations
- The **red line** (`output_span`) consistently matches the y-axis maximum, suggesting it represents a fixed or target token count.
- The **blue line** (`first_consistent_span`) exhibits high variability, with peaks aligning roughly every 10 request IDs.
- The **green line** (`second_consistent_span`) shows transient activity only at request IDs 10 and 20, possibly indicating isolated events.
- No overlap between green and blue lines except during the green peaks, where blue dips slightly.
### Interpretation
- The **output_span** (red) likely represents a standardized or maximum token threshold, possibly a target for processing.
- The **first_consistent_span** (blue) reflects dynamic token usage, potentially tied to input complexity or algorithmic variability. Its regular peaks may correlate with specific request types or processing stages.
- The **second_consistent_span** (green) anomalies at IDs 10 and 20 could indicate rare events, errors, or special cases requiring further investigation.
- The absence of green activity after request ID 20 suggests a system change or resolution of the anomaly.
*Note: All values are approximate due to the absence of gridlines or exact numerical annotations.*