\n
## Line Chart: Training Loss Curve
### Overview
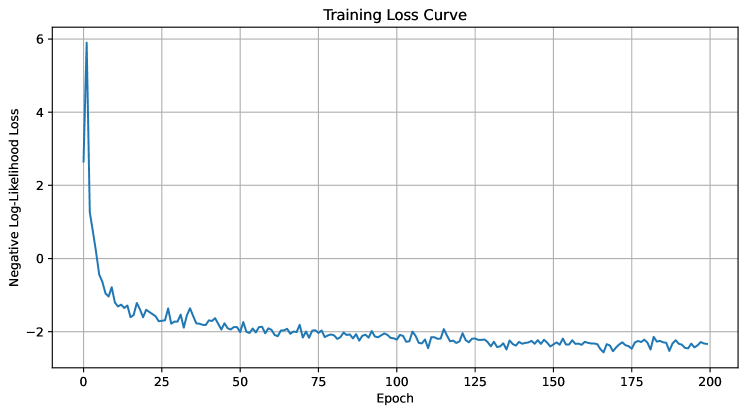
The image displays a line chart illustrating the training loss curve, showing the relationship between the negative log-likelihood loss and the epoch number during a training process. The chart indicates how the loss decreases over time as the model learns.
### Components/Axes
* **Title:** "Training Loss Curve" - positioned at the top-center of the chart.
* **X-axis:** "Epoch" - ranging from 0 to 200, with tick marks every 25 epochs.
* **Y-axis:** "Negative Log-Likelihood Loss" - ranging from approximately 0 to 6, with tick marks every 1 unit.
* **Data Series:** A single blue line representing the training loss.
* **Grid:** A light gray grid is present in the background to aid in reading values.
### Detailed Analysis
The blue line representing the training loss starts at approximately 5.8 at Epoch 0 and rapidly decreases.
Here's a breakdown of approximate values at specific epochs:
* Epoch 0: Loss ≈ 5.8
* Epoch 5: Loss ≈ 4.0
* Epoch 10: Loss ≈ 2.5
* Epoch 15: Loss ≈ 1.5
* Epoch 20: Loss ≈ 1.0
* Epoch 25: Loss ≈ 0.8
* Epoch 50: Loss ≈ 0.3
* Epoch 75: Loss ≈ 0.2
* Epoch 100: Loss ≈ 0.15
* Epoch 125: Loss ≈ 0.1
* Epoch 150: Loss ≈ 0.08
* Epoch 175: Loss ≈ 0.07
* Epoch 200: Loss ≈ 0.06
The line initially exhibits a steep downward slope, indicating rapid learning. After approximately Epoch 25, the rate of decrease slows down significantly. The line fluctuates around a value of approximately 0.1 to 0.2 from Epoch 50 to Epoch 200, suggesting the model is converging and the loss is stabilizing. There are minor oscillations in the loss value, indicating some degree of instability or noise in the training process.
### Key Observations
* **Rapid Initial Decrease:** The loss decreases dramatically in the first 25 epochs.
* **Convergence:** The loss stabilizes after Epoch 50, indicating the model is converging.
* **Fluctuations:** Minor fluctuations in the loss value suggest some instability or noise.
* **No Clear Overfitting:** The loss does not increase after a certain point, suggesting the model is not overfitting to the training data.
### Interpretation
The training loss curve demonstrates a typical learning pattern for a machine learning model. The initial steep decrease indicates that the model is quickly learning to fit the training data. The subsequent stabilization of the loss suggests that the model has converged to a reasonably good solution. The minor fluctuations in the loss value are expected and can be attributed to the stochastic nature of the training process or the presence of noise in the data. The absence of an increase in loss after a certain point suggests that the model is generalizing well to the training data and is not overfitting. This curve suggests the training process was successful, and the model has learned to minimize the negative log-likelihood loss on the training data. Further evaluation on a validation set would be necessary to confirm the model's generalization performance.