\n
## Diagram: Floor Plan with Movement Indicators
### Overview
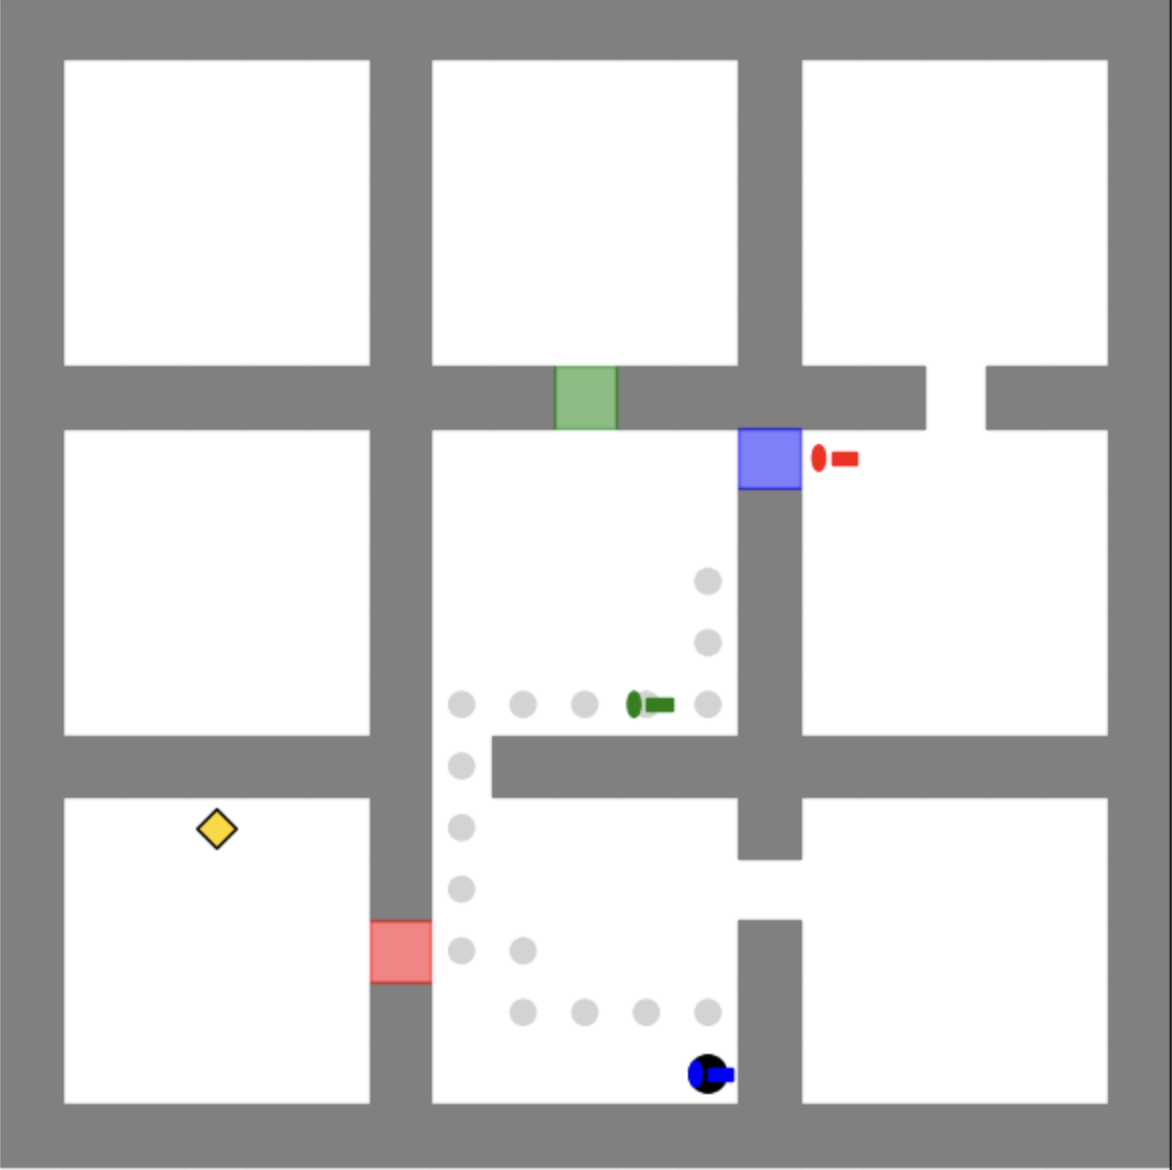
The image depicts a simplified floor plan, likely of a building or complex, with a network of corridors and rooms. Several colored markers are overlaid on the plan, indicating movement or locations. The markers are shaped as lines and diamonds, and their colors are red, green, blue, and yellow. There are also several gray circles scattered throughout the plan. The background is a grid of gray rectangles representing walls or room boundaries.
### Components/Axes
The diagram lacks explicit axes or scales. The components are:
* **Walls/Rooms:** Represented by gray rectangles.
* **Corridors:** White spaces between the gray rectangles.
* **Markers:** Colored lines and diamonds indicating locations or movement paths.
* **Circles:** Gray circles scattered throughout the plan.
### Detailed Analysis or Content Details
The diagram contains the following markers:
* **Yellow Diamond:** Located in the bottom-left corner of the plan.
* **Red Line:** Positioned in the top-right quadrant, oriented horizontally.
* **Green Line:** Located in the center of the plan, oriented horizontally.
* **Blue Circle with a Dot:** Located in the bottom-right quadrant.
* **Red Rectangle:** Located in the bottom-left quadrant.
* **Green Rectangle:** Located in the top-center quadrant.
* **Gray Circles:** Approximately 10 gray circles are distributed throughout the central and lower-central areas of the plan. They appear to follow a somewhat linear path.
### Key Observations
* The colored lines and diamond appear to indicate a path or sequence of locations.
* The gray circles may represent a separate, related path or a series of points of interest.
* The arrangement of the gray rectangles suggests a structured environment, such as a building or facility.
* There is no numerical data or quantitative information present in the diagram.
### Interpretation
The diagram likely represents a movement pattern or a sequence of events within a defined space. The colored markers could indicate the path of a person, object, or process. The gray circles might represent a secondary path or a set of data points related to the primary movement. The lack of labels or context makes it difficult to determine the specific meaning of the diagram. It could be a security patrol route, a delivery path, or a simulation of movement within a building. The diagram is a visual representation of spatial relationships and movement, but it requires additional information to be fully understood. The arrangement of the gray rectangles suggests a deliberate layout, indicating a designed environment rather than a random arrangement. The placement of the markers suggests a purposeful route or sequence of actions. Without further context, the diagram remains open to interpretation.