## Grid-Based Schematic Diagram: Spatial Layout with Colored Entities
### Overview
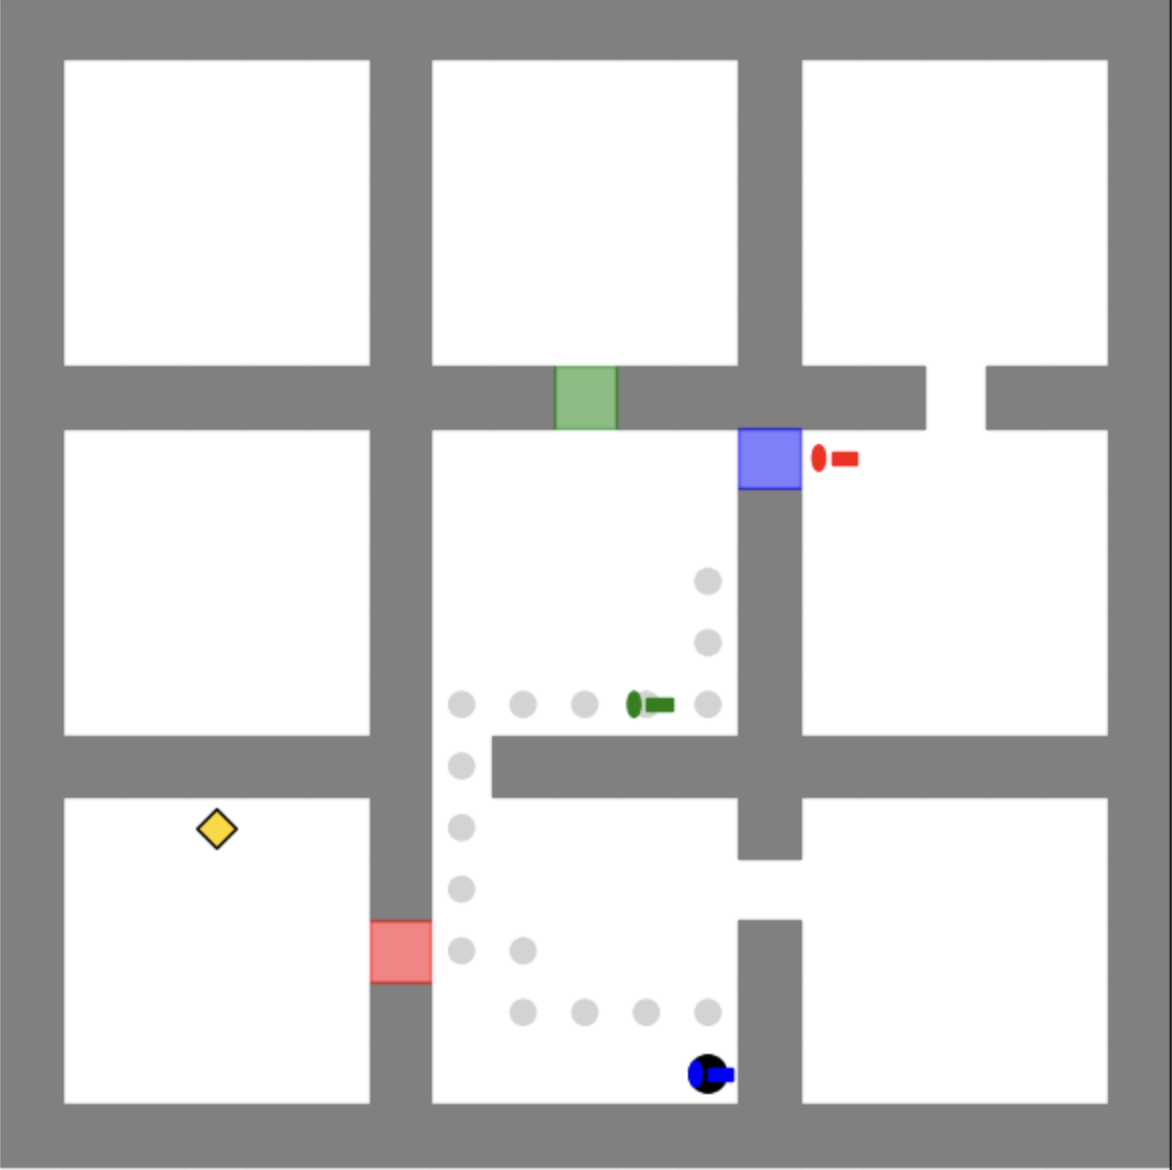
The image depicts a 3x3 grid layout with gray dividing lines, containing colored geometric shapes and dots. A legend in the bottom-right corner maps colors to labels. The arrangement suggests a spatial simulation or pathfinding scenario.
### Components/Axes
- **Grid Structure**:
- 3 rows and 3 columns separated by gray lines.
- Sections labeled by position (e.g., "top-left," "bottom-right").
- **Legend** (bottom-right corner):
- **Green**: Obstacle
- **Blue**: Agent
- **Red**: Target
- **Pink**: Start
- **Yellow**: Destination
- **Gray Dots**: Path nodes
- **Colored Dots**: Status markers (green=active, red=blocked, blue=pending)
### Detailed Analysis
1. **Top-Left Section**:
- Contains a **yellow diamond** labeled "Destination" in the legend.
2. **Top-Middle Section**:
- Contains a **green rectangle** labeled "Obstacle."
3. **Top-Right Section**:
- Empty.
4. **Middle-Left Section**:
- Contains a **pink rectangle** labeled "Start."
5. **Middle Section**:
- Contains a **blue square** labeled "Agent."
- Contains a **red horizontal line** labeled "Target."
6. **Middle-Right Section**:
- Contains a **white vertical line** (unlabeled in legend).
7. **Bottom-Left Section**:
- Contains a **pink rectangle** labeled "Start."
8. **Bottom-Middle Section**:
- Contains a **green dot** (active status) and a **red dot** (blocked status).
9. **Bottom-Right Section**:
- Contains a **blue dot** (pending status).
10. **Path Nodes**:
- **Gray dots** form a zigzag path from the bottom-left to the top-right, passing through the middle section.
### Key Observations
- The **Agent** (blue square) is positioned near the **Target** (red line) in the middle-right section.
- The **Start** (pink rectangle) appears twice: once in the top-left and once in the bottom-left.
- The **Obstacle** (green rectangle) blocks the top-middle section.
- The **Path nodes** (gray dots) suggest a navigational route from the bottom-left to the top-right, avoiding the obstacle.
- The **colored dots** (green, red, blue) are spatially isolated from the path nodes, possibly indicating status updates or secondary entities.
### Interpretation
This diagram likely represents a simplified simulation of spatial navigation or resource allocation:
- The **Agent** (blue square) may be tasked with moving from the **Start** (pink) to the **Destination** (yellow) while avoiding the **Obstacle** (green).
- The **Path nodes** (gray dots) define a predefined route, with the **colored dots** (green/red/blue) possibly representing dynamic status changes (e.g., active/blocked/pending nodes).
- The **Target** (red line) in the middle-right section could indicate a secondary objective or checkpoint.
- The duplication of the **Start** (pink) suggests multiple entry points or a cyclical process.
The layout emphasizes spatial relationships and decision-making constraints, typical of pathfinding algorithms or grid-based strategy games.