## Diagram: Data Flow
### Overview
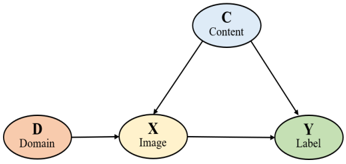
The image is a diagram illustrating a data flow between four components: Domain, Image, Content, and Label. The diagram uses ovals to represent each component and arrows to indicate the direction of data flow.
### Components/Axes
* **D (Domain)**: Located on the left side of the diagram, colored peach.
* **X (Image)**: Located in the center of the diagram, colored light yellow.
* **C (Content)**: Located at the top of the diagram, colored light blue.
* **Y (Label)**: Located on the right side of the diagram, colored light green.
### Detailed Analysis
* **Flow 1**: From D (Domain) to X (Image).
* **Flow 2**: From C (Content) to X (Image).
* **Flow 3**: From C (Content) to Y (Label).
* **Flow 4**: From X (Image) to Y (Label).
### Key Observations
* The Domain (D) only influences the Image (X).
* The Content (C) influences both the Image (X) and the Label (Y).
* The Image (X) influences the Label (Y).
* The Label (Y) is influenced by both Content (C) and Image (X).
### Interpretation
The diagram represents a system where the Domain influences the Image, and the Content influences both the Image and the Label. The Image also directly influences the Label. This suggests a process where the Domain provides the context for the Image, the Content provides information that is used to generate both the Image and the Label, and the Image itself contributes to the final Label. The Content is a key factor in determining both the Image and the Label, indicating a strong relationship between them.