\n
## Diagram: Conceptual Relationship Model
### Overview
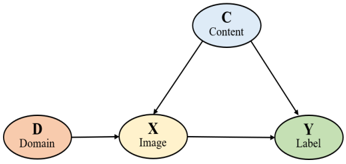
The image depicts a diagram illustrating a conceptual relationship between four elements: Domain, Image, Content, and Label. These elements are represented as ovals and connected by arrows indicating a directional relationship. The diagram appears to model a process or system where a Domain and Image contribute to Content, and both Image and Content contribute to a Label.
### Components/Axes
The diagram consists of four labeled ovals:
* **D Domain** (Peach/Orange color) - Located on the left side of the diagram.
* **X Image** (Yellow color) - Positioned centrally, slightly below the top center.
* **C Content** (Blue color) - Located at the top of the diagram.
* **Y Label** (Green color) - Positioned on the right side of the diagram.
Arrows connect the elements, indicating the flow of influence or relationship:
* An arrow points from "D Domain" to "X Image".
* An arrow points from "X Image" to "C Content".
* An arrow points from "X Image" to "Y Label".
* An arrow points from "C Content" to "Y Label".
### Detailed Analysis or Content Details
The diagram shows a directed graph with the following relationships:
1. **Domain -> Image:** The Domain influences or contributes to the Image.
2. **Image -> Content:** The Image influences or contributes to the Content.
3. **Image -> Label:** The Image influences or contributes to the Label.
4. **Content -> Label:** The Content influences or contributes to the Label.
There are no numerical values or scales present in the diagram. It is a purely conceptual representation.
### Key Observations
The diagram highlights the Image as a central component, as it has outgoing connections to both Content and Label. The Domain and Content both contribute to the final Label, but through different pathways. The diagram suggests a process where the Domain is transformed into an Image, which then contributes to both the Content and the Label.
### Interpretation
This diagram likely represents a simplified model of a data processing or information generation pipeline. The "Domain" could represent the source data or the real-world context. The "Image" could be a representation of that data, such as a visual representation or a feature vector. The "Content" could be the information extracted from the Image, and the "Label" could be the final classification or annotation assigned to the Image.
The diagram suggests that both the raw Image and the extracted Content are necessary to generate the final Label. This could be interpreted as a need for both low-level features and high-level understanding in a machine learning or computer vision task. The diagram is abstract and doesn't specify the nature of the relationships, but it provides a useful framework for thinking about how different components interact in a complex system.