## Logic Derivation Tree Diagram: Proof Structure for ¬p(X) ∨ q(f(X),c)
### Overview
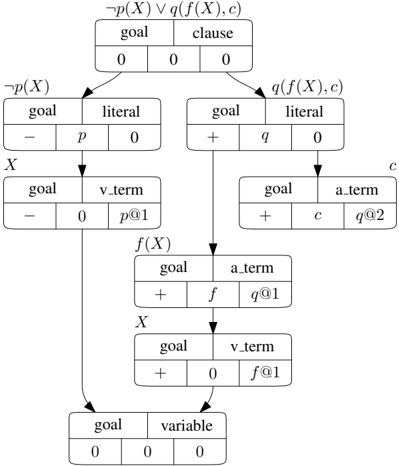
The image displays a hierarchical tree diagram representing a logical derivation or proof structure, likely from computational logic, automated theorem proving, or formal semantics. It illustrates the decomposition of a top-level logical clause into subgoals and terms through a series of connected nodes. The diagram uses a formal notation with tables inside each node to specify roles and states.
### Components/Axes
The diagram is structured as a tree with a single root node at the top and multiple child nodes connected by downward-pointing arrows. There are no traditional chart axes. The key components are:
1. **Nodes:** Each node is a rectangular box containing a table with two rows.
* **Top Row:** Contains a label (e.g., "goal", "clause", "literal", "v_term", "a_term", "variable").
* **Bottom Row:** Contains three cells with symbols, variables, or numbers (e.g., `0`, `+`, `-`, `p`, `q`, `f`, `c`, `X`, `@1`, `@2`).
2. **Arrows:** Directed edges (arrows) connect parent nodes to child nodes, indicating the flow of derivation or decomposition.
3. **Logical Formula:** The root node is labeled with the formula `¬p(X) ∨ q(f(X),c)`.
### Detailed Analysis
The tree is processed from the top down. Below is a node-by-node breakdown, describing spatial placement and content.
**1. Root Node (Top Center)**
* **Label above table:** `¬p(X) ∨ q(f(X),c)`
* **Table Content:**
* Top Row: `goal` | `clause`
* Bottom Row: `0` | `0` | `0`
* **Children:** Two arrows point downward to two separate child nodes.
**2. Left Branch - Node 1 (Directly below root, left side)**
* **Label above table:** `¬p(X)`
* **Table Content:**
* Top Row: `goal` | `literal`
* Bottom Row: `-` | `p` | `0`
* **Child:** One arrow points downward to a node labeled `X`.
**3. Left Branch - Node 2 (Below Node 1)**
* **Label above table:** `X`
* **Table Content:**
* Top Row: `goal` | `v_term`
* Bottom Row: `-` | `0` | `p@1`
* **Child:** One arrow points downward to the final bottom node.
**4. Right Branch - Node 1 (Directly below root, right side)**
* **Label above table:** `q(f(X),c)`
* **Table Content:**
* Top Row: `goal` | `literal`
* Bottom Row: `+` | `q` | `0`
* **Children:** Two arrows point downward. One goes to a node labeled `f(X)`, the other to a node labeled `c`.
**5. Right Branch - Node 2a (Below Right Node 1, right side)**
* **Label above table:** `c`
* **Table Content:**
* Top Row: `goal` | `a_term`
* Bottom Row: `+` | `c` | `q@2`
* **Child:** None shown (terminal node).
**6. Right Branch - Node 2b (Below Right Node 1, left side)**
* **Label above table:** `f(X)`
* **Table Content:**
* Top Row: `goal` | `a_term`
* Bottom Row: `+` | `f` | `q@1`
* **Child:** One arrow points downward to a node labeled `X`.
**7. Right Branch - Node 3 (Below Node 2b)**
* **Label above table:** `X`
* **Table Content:**
* Top Row: `goal` | `v_term`
* Bottom Row: `+` | `0` | `f@1`
* **Child:** One arrow points downward to the final bottom node.
**8. Bottom Node (Bottom Center)**
* **Label above table:** (None)
* **Table Content:**
* Top Row: `goal` | `variable`
* Bottom Row: `0` | `0` | `0`
* **Parents:** Receives arrows from both the Left Branch Node 2 (`X`) and the Right Branch Node 3 (`X`).
### Key Observations
1. **Symmetry and Convergence:** The tree has a symmetrical structure branching from the root, but the two main branches (`¬p(X)` and `q(f(X),c)`) are processed differently. Both branches ultimately resolve to the same variable `X`, which converges into a single terminal "variable" node at the bottom.
2. **State Indicators:** The bottom row of each table uses symbols (`+`, `-`, `0`) that likely indicate the polarity, truth value, or proof state of that subgoal (e.g., `+` for positive/true, `-` for negative/false, `0` for unbound/neutral).
3. **Term Types:** The diagram distinguishes between `v_term` (variable term, for `X`) and `a_term` (atomic or applied term, for `c` and `f(X)`).
4. **Indexing Notation:** The symbols `p@1`, `q@1`, `q@2`, and `f@1` appear in the third cell of the bottom rows. These likely represent unique identifiers or occurrence markers for literals and function applications within the proof context.
5. **Flow Direction:** The derivation flows strictly top-down, from the complex clause to its constituent literals and finally to the shared variable.
### Interpretation
This diagram is a formal representation of a **resolution proof step** or a **goal-directed search** in logic programming (like Prolog). It demonstrates how the disjunctive goal `¬p(X) ∨ q(f(X),c)` is decomposed.
* **What it represents:** The process shows the attempt to prove the top-level clause. The left branch handles the negative literal `¬p(X)`, and the right branch handles the positive literal `q(f(X),c)`. The function `f(X)` and constant `c` are broken down into their components (`a_term`), and the variable `X` is identified as a common element (`v_term`) that must be unified or resolved.
* **Relationships:** The tree explicitly maps the syntactic structure of the logical formula. The convergence on the bottom `variable` node for `X` highlights that this variable is the key linking element between the two subgoals; its instantiation will affect both `p(X)` and `q(f(X),c)`.
* **Notable Pattern:** The use of `+` in the entire right branch (`q` literal and its terms) versus `-` in the left branch (`p` literal) suggests a polarity-based proof search, where positive goals are proved by finding facts/rules and negative goals are proved by refutation. The `0` values in the root and terminal nodes may indicate the starting and ending points of this particular derivation fragment.
* **Purpose:** Such diagrams are used in computer science and logic to visualize, debug, and teach the mechanics of automated reasoning algorithms, unification, and proof construction. It makes the abstract process of logical inference concrete and traceable.