## Flowchart Diagram: Logical Formula Decomposition
### Overview
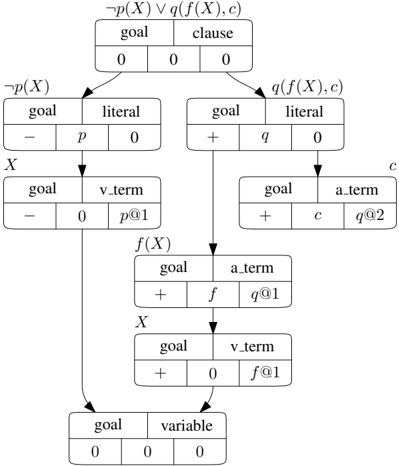
The diagram represents a hierarchical decomposition of a logical formula, illustrating relationships between variables, literals, clauses, and goals. It uses arrows to denote dependencies and transformations, with boxes containing symbolic logic expressions and numerical values.
### Components/Axes
- **Top Box**:
- Label: `¬p(X) ∨ q(f(X), c)`
- Subcomponents:
- `goal`: `0`
- `clause`: `0`
- `0` (value)
- Arrows point to two child boxes:
1. Left: `¬p(X)`
2. Right: `q(f(X), c)`
- **Left Branch (`¬p(X)`)**:
- Box 1:
- `goal`: `-`
- `literal`: `p`
- `0` (value)
- Box 2:
- `goal`: `-`
- `v_term`: `p@1`
- `0` (value)
- **Right Branch (`q(f(X), c)`)**:
- Box 1:
- `goal`: `+`
- `literal`: `q`
- `0` (value)
- Box 2:
- `goal`: `+`
- `a_term`: `c`
- `q@2` (value)
- **Intermediate Boxes**:
- `f(X)`:
- `goal`: `+`
- `a_term`: `f`
- `q@1` (value)
- `X`:
- `goal`: `+`
- `v_term`: `f@1`
- `0` (value)
- **Bottom Box**:
- `goal`: `0`
- `variable`: `0`
- `0` (value)
### Detailed Analysis
- **Logical Structure**:
- The top formula `¬p(X) ∨ q(f(X), c)` is split into two branches via disjunction (`∨`).
- The left branch (`¬p(X)`) introduces negation (`-`) and a variable term (`p@1`).
- The right branch (`q(f(X), c)`) uses conjunction (`+`) and includes a function application (`f(X)`) and constant (`c`).
- **Symbolic Values**:
- `0` appears frequently, likely representing "false" or "no contribution."
- `+` and `-` denote logical operators (conjunction/disjunction).
- `@1` and `@2` may indicate variable instances or positional markers.
- **Flow Direction**:
- Arrows flow downward from the top formula to subcomponents, suggesting a top-down decomposition.
- Variables (`X`, `f(X)`, `c`) are linked to their respective terms (`p@1`, `q@1`, `q@2`).
### Key Observations
1. **Hierarchical Decomposition**: The diagram breaks down a complex formula into atomic components (variables, literals, clauses).
2. **Logical Operators**: The use of `+` and `-` suggests a formal system (e.g., propositional logic or a knowledge base).
3. **Variable Instantiation**: `@1` and `@2` imply multiple instances of variables, possibly for substitution or evaluation.
4. **Goal Values**: The `goal` field in each box may represent evaluation priorities or constraints.
### Interpretation
This diagram likely models a logical reasoning process, such as:
- **Automated Theorem Proving**: Decomposing a formula into subgoals for evaluation.
- **Knowledge Representation**: Structuring relationships between variables, functions, and constants.
- **Constraint Satisfaction**: Tracking how variables and literals contribute to satisfying a formula.
The repeated use of `0` and `+`/`-` suggests a binary evaluation system, where components are either "active" (`+`) or "inactive" (`-`). The flow from the top formula to variables indicates a dependency chain, where higher-level goals depend on lower-level variable assignments.
**Notable Patterns**:
- The right branch (`q(f(X), c)`) introduces more complexity with function application and constants.
- The bottom box’s `goal: 0` may signify a terminal state or unresolved condition.
**Underlying Logic**:
The diagram reflects a formal system where logical formulas are recursively broken into evaluable units. The use of `@` notation implies variable binding or substitution, critical in automated reasoning or symbolic computation.