\n
## Diagram: Sequential vs. Parallel Scaling of Reasoning Processes
### Overview
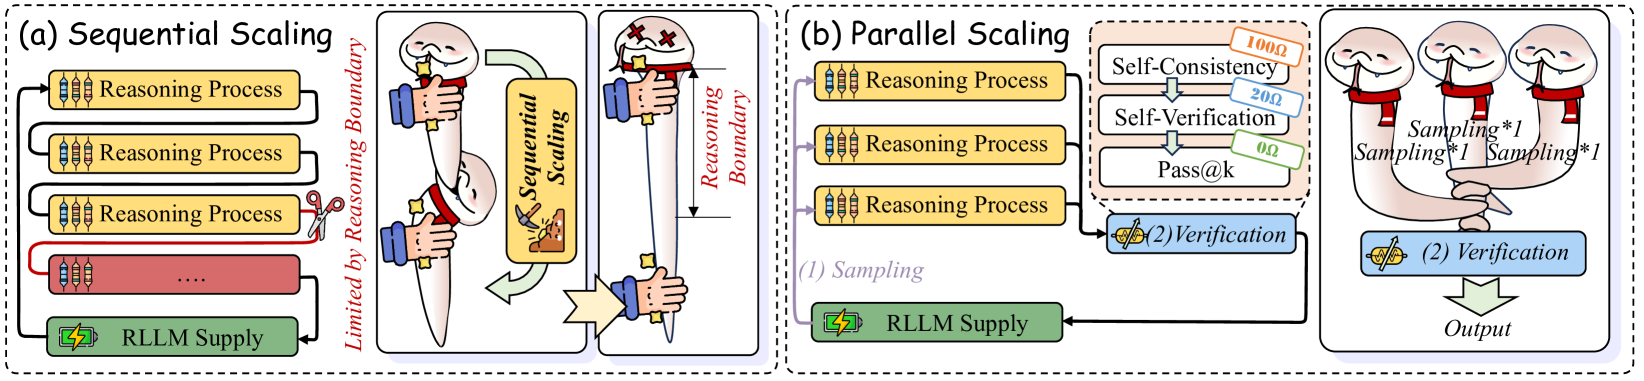
The image presents a comparative diagram illustrating two scaling approaches for reasoning processes: Sequential Scaling and Parallel Scaling. Both approaches utilize an "RLLM Supply" as a foundational element. The diagram visually contrasts how reasoning is performed and verified in each method, highlighting the limitations of sequential scaling and the benefits of parallel scaling.
### Components/Axes
The diagram is divided into two main sections, labeled "(a) Sequential Scaling" and "(b) Parallel Scaling". Each section contains several key components:
* **RLLM Supply:** Present in both sections, represented by a green box with a gear icon.
* **Reasoning Process:** Represented by orange boxes in both sections.
* **Sequential Scaling:** A central visual element in section (a), depicted as a construction site with workers building a tower.
* **Parallel Scaling:** A central visual element in section (b), depicted as multiple figures brainstorming around a central idea.
* **Self-Consistency:** A label and associated value (100Ω) in section (b).
* **Self-Verification:** A label and associated value (20Ω) in section (b).
* **Pass@k:** A label and associated value (0Ω) in section (b).
* **(1) Sampling:** A label in section (b).
* **(2) Verification:** A label in section (b).
* **Output:** A label in section (b).
* **Reasoning Boundary:** A dashed line separating the RLLM Supply from the reasoning processes in both sections.
* **Limited by Reasoning Boundary:** A label pointing to the dashed line in section (a).
### Detailed Analysis or Content Details
**(a) Sequential Scaling:**
* The "RLLM Supply" feeds into a series of "Reasoning Process" blocks stacked vertically. The number of "Reasoning Process" blocks is indicated by "..." suggesting an indefinite number.
* The output of these sequential reasoning processes is visualized as being used to build a tower, representing "Sequential Scaling".
* A red arrow points from the tower to the "Reasoning Boundary", with the label "Limited by Reasoning Boundary". This suggests the scaling is constrained by the sequential nature of the process.
**(b) Parallel Scaling:**
* The "RLLM Supply" feeds into multiple "Reasoning Process" blocks arranged in a circular pattern around a central brainstorming area.
* The brainstorming area features labels and values:
* "Self-Consistency": 100Ω (Omega symbol)
* "Self-Verification": 20Ω (Omega symbol)
* "Pass@k": 0Ω (Omega symbol)
* The output of the reasoning processes is fed into a "(1) Sampling" stage, followed by a "(2) Verification" stage, ultimately leading to an "Output".
* Multiple figures are depicted performing "Sampling" and "Verification" around the central brainstorming area.
### Key Observations
* Sequential Scaling appears to be a linear, step-by-step process, potentially bottlenecked by the "Reasoning Boundary".
* Parallel Scaling utilizes multiple reasoning processes simultaneously, suggesting a more efficient and scalable approach.
* The values associated with "Self-Consistency", "Self-Verification", and "Pass@k" in the Parallel Scaling section (100Ω, 20Ω, 0Ω respectively) may represent some form of cost or efficiency metric. The lower values for Self-Verification and Pass@k suggest they are more efficient processes.
* The visual metaphor of building a tower versus brainstorming highlights the difference in approach: sequential construction versus collaborative ideation.
### Interpretation
The diagram illustrates a comparison between two methods for scaling reasoning capabilities, likely within a large language model (LLM) context, given the "RLLM Supply" component. Sequential Scaling represents a traditional approach where reasoning steps are performed one after another, potentially limiting overall performance due to the "Reasoning Boundary". Parallel Scaling, on the other hand, leverages multiple reasoning processes concurrently, enabling faster and more efficient scaling. The values associated with Self-Consistency, Self-Verification, and Pass@k likely represent computational costs or performance metrics, suggesting that parallel scaling with self-verification and consistency checks can be more efficient than relying solely on achieving a certain "Pass@k" rate. The diagram suggests that parallel scaling is a more promising approach for achieving significant improvements in reasoning capabilities. The use of visual metaphors (construction vs. brainstorming) effectively conveys the core differences between the two methods. The diagram does not provide specific numerical data beyond the Omega values, but focuses on illustrating the conceptual differences in scaling strategies.