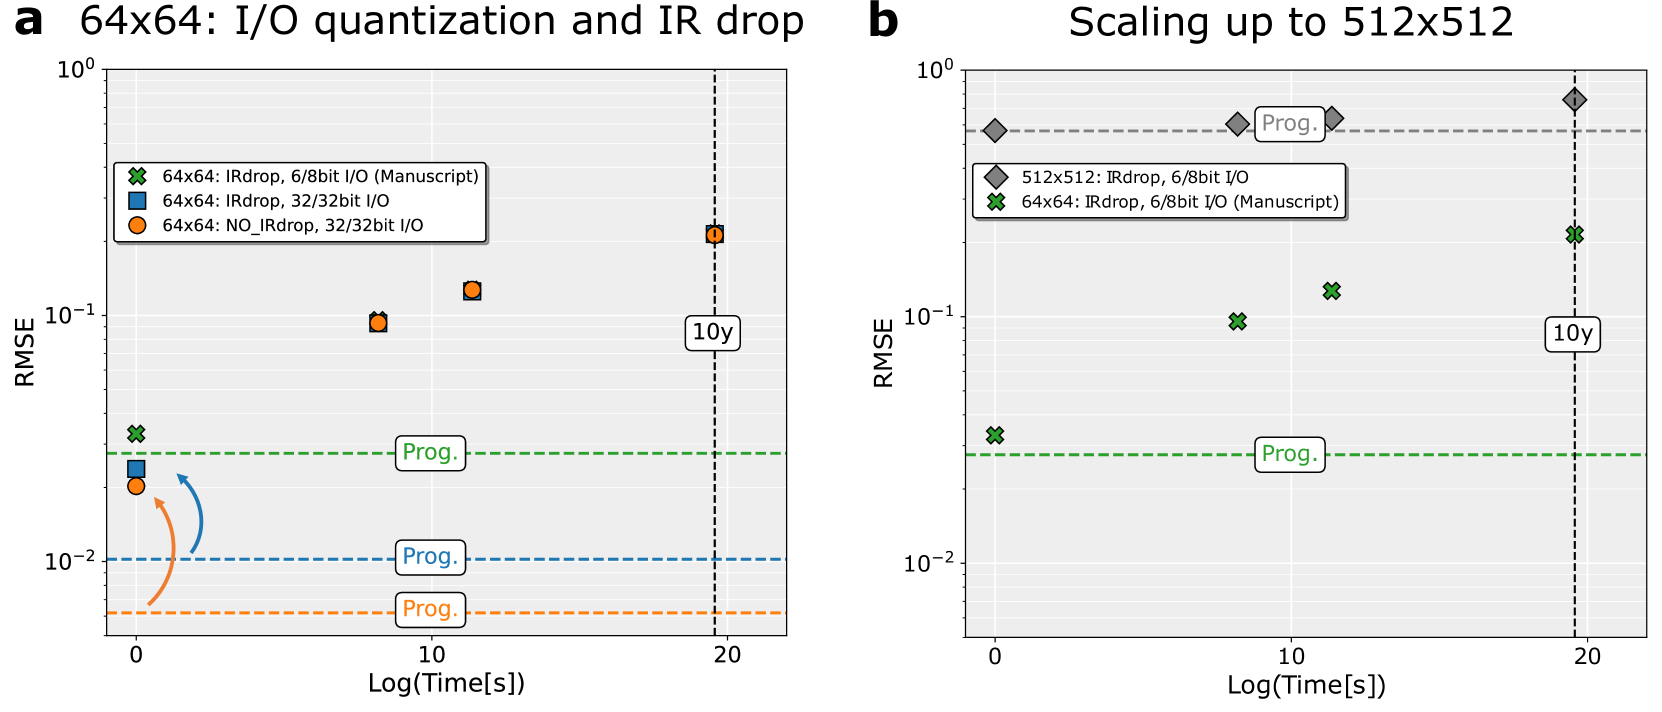
## Chart: I/O Quantization and IR Drop vs. Scaling
### Overview
The image presents two scatter plots comparing Root Mean Square Error (RMSE) against Log(Time[s]) for different I/O configurations and scaling factors. Plot 'a' focuses on 64x64 resolution with varying I/O quantization and IR drop settings, while plot 'b' compares 64x64 and 512x512 resolutions with a specific I/O configuration. Both plots include horizontal dashed lines labeled "Prog." and a vertical dashed line labeled "10y".
### Components/Axes
**Plot a: 64x64: I/O quantization and IR drop**
* **X-axis:** Log(Time[s]), with tick marks at 0, 10, and 20.
* **Y-axis:** RMSE, with a logarithmic scale ranging from 10^-2 to 10^0.
* **Legend (top-left):**
* Green 'x': 64x64: IRdrop, 6/8bit I/O (Manuscript)
* Blue square: 64x64: IRdrop, 32/32bit I/O
* Orange circle: 64x64: NO\_IRdrop, 32/32bit I/O
* **Horizontal Dashed Lines:**
* Green: "Prog." located near y = 0.03
* Blue: "Prog." located near y = 0.01
* Orange: "Prog." located near y = 0.006
* **Vertical Dashed Line:** Located at x = 20, labeled "10y".
**Plot b: Scaling up to 512x512**
* **X-axis:** Log(Time[s]), with tick marks at 0, 10, and 20.
* **Y-axis:** RMSE, with a logarithmic scale ranging from 10^-2 to 10^0.
* **Legend (top-right):**
* Gray diamond: 512x512: IRdrop, 6/8bit I/O
* Green 'x': 64x64: IRdrop, 6/8bit I/O (Manuscript)
* **Horizontal Dashed Lines:**
* Green: "Prog." located near y = 0.03
* Gray: "Prog." located near y = 0.6
* **Vertical Dashed Line:** Located at x = 20, labeled "10y".
### Detailed Analysis
**Plot a: 64x64: I/O quantization and IR drop**
* **64x64: IRdrop, 6/8bit I/O (Manuscript) (Green 'x'):**
* At x=0, RMSE ≈ 0.03
* At x=20, RMSE ≈ 0.03
* Trend: Relatively constant.
* **64x64: IRdrop, 32/32bit I/O (Blue square):**
* At x=0, RMSE ≈ 0.02
* At x=10, RMSE ≈ 0.09
* At x=20, RMSE ≈ 0.13
* Trend: Increasing.
* **64x64: NO\_IRdrop, 32/32bit I/O (Orange circle):**
* At x=0, RMSE ≈ 0.015
* At x=10, RMSE ≈ 0.09
* At x=20, RMSE ≈ 0.18
* Trend: Increasing.
**Plot b: Scaling up to 512x512**
* **512x512: IRdrop, 6/8bit I/O (Gray diamond):**
* At x=0, RMSE ≈ 0.6
* At x=10, RMSE ≈ 0.6
* At x=20, RMSE ≈ 0.7
* Trend: Relatively constant.
* **64x64: IRdrop, 6/8bit I/O (Manuscript) (Green 'x'):**
* At x=0, RMSE ≈ 0.03
* At x=10, RMSE ≈ 0.09
* At x=20, RMSE ≈ 0.1
* Trend: Increasing.
### Key Observations
* In plot 'a', increasing the bit depth from 6/8 to 32/32 for the 64x64 resolution, while keeping IRdrop, results in a higher RMSE as Log(Time[s]) increases. Removing IRdrop also results in a higher RMSE.
* In plot 'b', scaling up to 512x512 with 6/8bit I/O and IRdrop leads to a significantly higher RMSE compared to the 64x64 configuration with the same settings.
* The "Prog." lines seem to represent some kind of performance target or threshold.
* The "10y" line at Log(Time[s]) = 20 likely indicates a specific time point of interest (10 years).
### Interpretation
The plots suggest that I/O quantization and IR drop significantly impact the RMSE, especially as the simulation time increases. For the 64x64 resolution, using lower bit depths (6/8) and including IR drop results in lower RMSE values compared to higher bit depths (32/32) or removing IR drop. Scaling up to 512x512 dramatically increases the RMSE, indicating a potential trade-off between resolution and accuracy for the given I/O configuration. The "Prog." lines likely represent acceptable error thresholds, and the data indicates whether each configuration meets those thresholds. The "10y" marker suggests a long-term performance evaluation point.