## Flowchart: User-AI Interaction Dynamics and Outcomes
### Overview
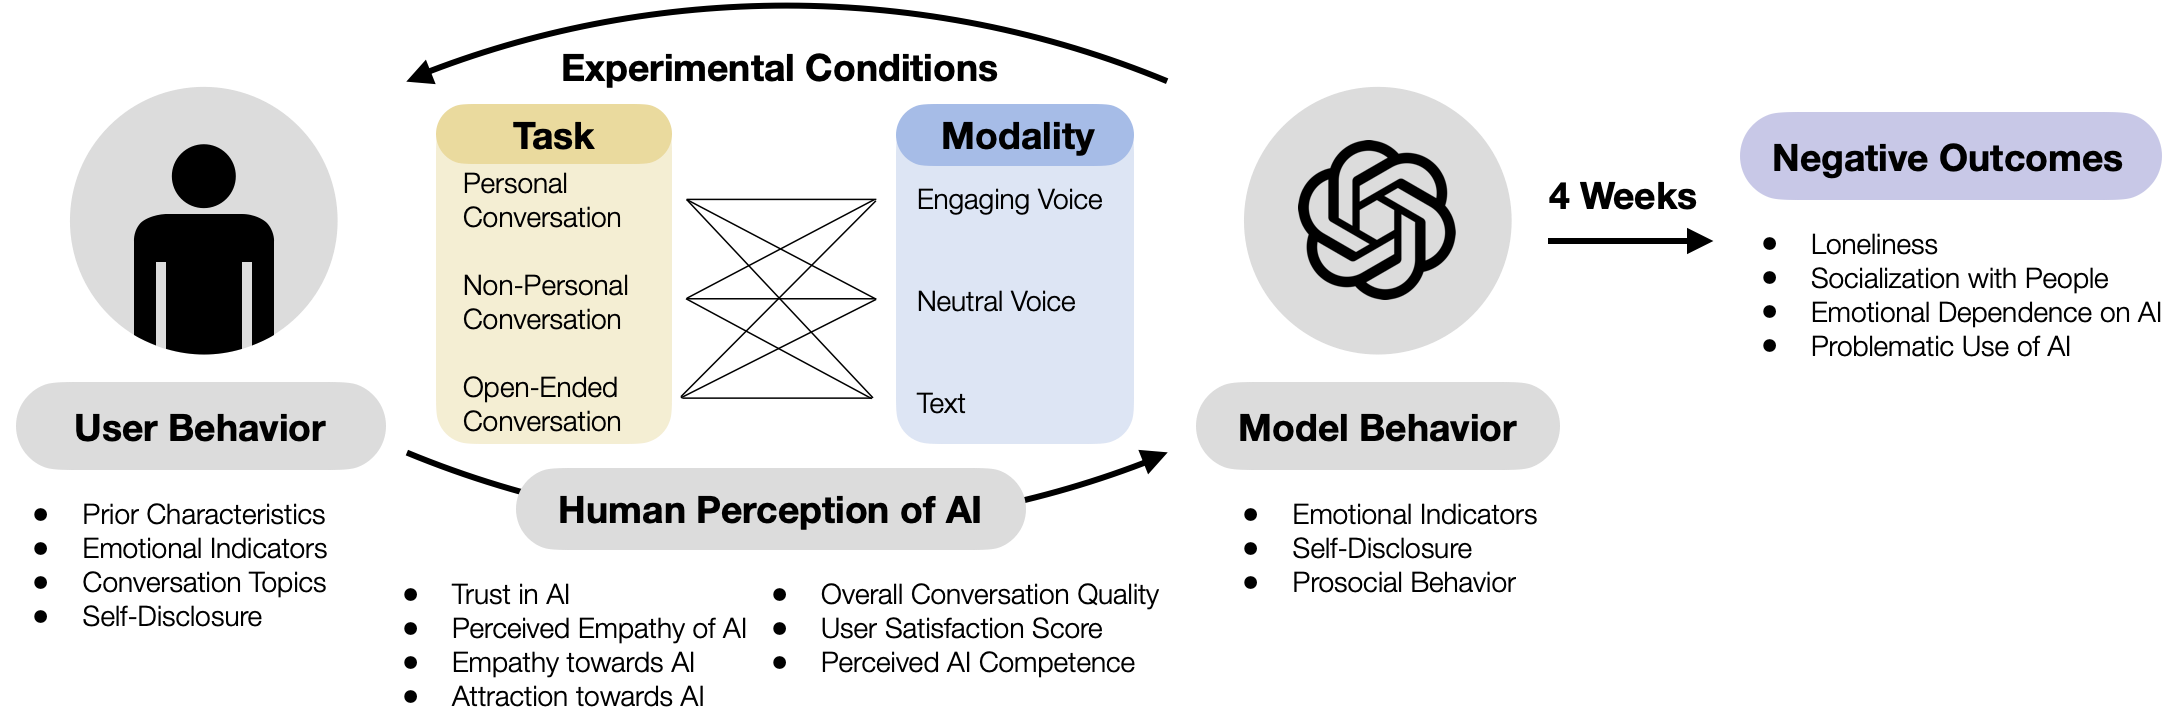
The diagram illustrates a cyclical relationship between user behavior, experimental conditions, human perception of AI, model behavior, and long-term negative outcomes. It emphasizes how different conversational tasks, modalities, and AI characteristics influence user experiences and societal impacts over time.
### Components/Axes
1. **User Behavior** (Left):
- Prior Characteristics
- Emotional Indicators
- Conversation Topics
- Self-Disclosure
2. **Experimental Conditions** (Central):
- **Task Matrix**:
- Personal Conversation
- Non-Personal Conversation
- Open-Ended Conversation
- **Modality**:
- Engaging Voice
- Neutral Voice
- Text
- Arrows connect tasks to modalities via a triangular matrix.
3. **Human Perception of AI** (Central):
- Trust in AI
- Perceived Empathy of AI
- Empathy towards AI
- Attraction towards AI
- Overall Conversation Quality
- User Satisfaction Score
- Perceived AI Competence
4. **Model Behavior** (Right):
- Emotional Indicators
- Self-Disclosure
- Prosocial Behavior
5. **Negative Outcomes** (Right, after 4 weeks):
- Loneliness
- Socialization with People
- Emotional Dependence on AI
- Problematic Use of AI
### Detailed Analysis
- **Task-Modality Matrix**: The central matrix shows all combinations of conversation types (rows) and modalities (columns), suggesting experimental variations in AI-human interaction.
- **Flow Direction**:
1. User Behavior → Experimental Conditions → Human Perception of AI
2. Human Perception of AI → Model Behavior
3. Model Behavior → Negative Outcomes (after 4 weeks)
- **Key Connections**:
- Emotional Indicators and Self-Disclosure appear in both User Behavior and Model Behavior, indicating bidirectional influence.
- "Perceived Empathy of AI" and "Empathy towards AI" suggest reciprocal emotional dynamics.
### Key Observations
- **Cyclical Nature**: The diagram implies a feedback loop where AI behavior influences user perception, which in turn shapes future interactions.
- **Time Delay**: Negative outcomes are explicitly tied to a 4-week timeframe, suggesting long-term consequences of short-term interactions.
- **Modality Impact**: The inclusion of voice/text modalities hints at modality-specific effects on user experience.
### Interpretation
This diagram frames AI-human interaction as a complex system with emergent properties. The central matrix suggests researchers are testing how different conversational contexts (task + modality) shape user perceptions. The bidirectional arrows between User Behavior and Model Behavior imply that AI systems may adapt based on user characteristics, creating a co-evolutionary dynamic.
The 4-week timeline for negative outcomes raises questions about:
1. **Addiction Potential**: How quickly do users develop emotional dependence?
2. **Social Displacement**: Does AI interaction reduce real-world socialization?
3. **Ethical Design**: Should AI systems limit self-disclosure capabilities to prevent dependency?
The absence of quantitative data suggests this is a conceptual framework for future research rather than an analysis of existing results. The emphasis on "perceived" attributes (empathy, competence) highlights the importance of subjective user experience over objective AI performance metrics.