## Line Chart: mAP on MagnaTagATune (VGGish)
### Overview
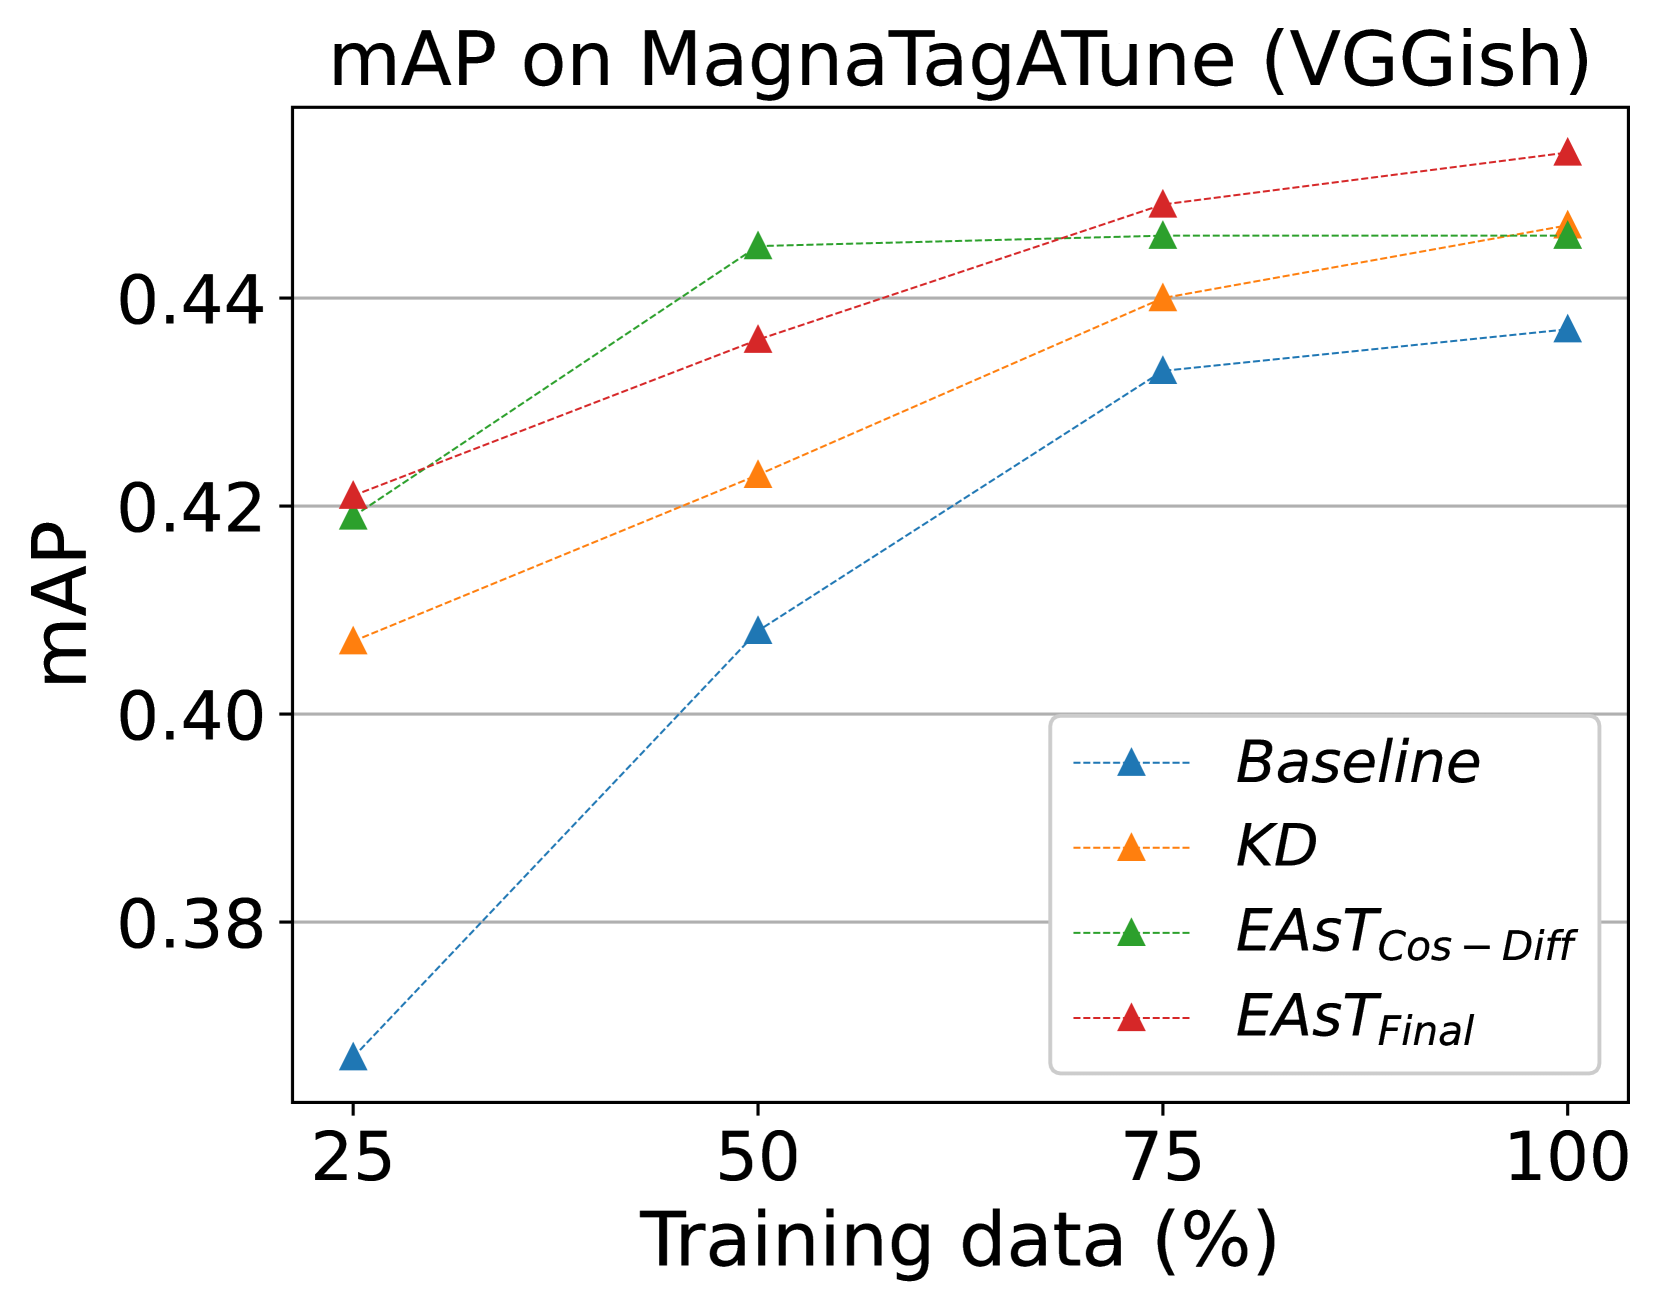
The chart illustrates the relationship between training data percentage (25% to 100%) and mean Average Precision (mAP) for four different models. Four data series are plotted with distinct line styles and markers, showing performance trends as training data increases.
### Components/Axes
- **X-axis**: Training data (%)
- Markers at 25%, 50%, 75%, and 100%
- Label: "Training data (%)"
- **Y-axis**: mAP
- Scale from 0.38 to 0.44 in increments of 0.02
- Label: "mAP"
- **Legend**: Located at bottom-right
- **Baseline**: Blue dashed line with triangle markers
- **KD**: Orange dotted line with triangle markers
- **EAST_Cos – Diff**: Green dash-dot line with triangle markers
- **EAST_Final**: Red dashed line with triangle markers
### Detailed Analysis
1. **Baseline (Blue)**:
- Starts at ~0.38 mAP at 25% training data.
- Increases linearly to ~0.44 mAP at 100%.
- Slope: Steady upward trend.
2. **KD (Orange)**:
- Begins at ~0.41 mAP at 25%.
- Rises sharply to ~0.44 mAP at 50%, then plateaus slightly.
- Reaches ~0.445 mAP at 100%.
3. **EAST_Cos – Diff (Green)**:
- Starts at ~0.42 mAP at 25%.
- Increases gradually to ~0.445 mAP at 100%.
- Slope: Consistent but less steep than KD.
4. **EAST_Final (Red)**:
- Begins at ~0.42 mAP at 25%.
- Shows the steepest ascent, reaching ~0.45 mAP at 100%.
- Outperforms all other models at higher training data percentages.
### Key Observations
- **EAST_Final** consistently achieves the highest mAP across all training data percentages.
- **KD** outperforms Baseline but underperforms EAST methods at 50% and 100% training data.
- All models show improved performance with increased training data, but EAST_Final demonstrates the most significant gains.
- At 100% training data, EAST_Final exceeds other models by ~0.005 mAP.
### Interpretation
The data suggests that **EAST_Final** is the most effective model for this task, particularly when leveraging larger training datasets. The Baseline model shows minimal improvement compared to others, indicating that KD and EAST methods incorporate more efficient training strategies. The steep slope of EAST_Final implies it benefits disproportionately from additional training data, possibly due to advanced feature extraction or regularization techniques. These results highlight the importance of model architecture design in optimizing performance on limited datasets.