\n
## Bar Chart: Articulates Trigger (%) by Category
### Overview
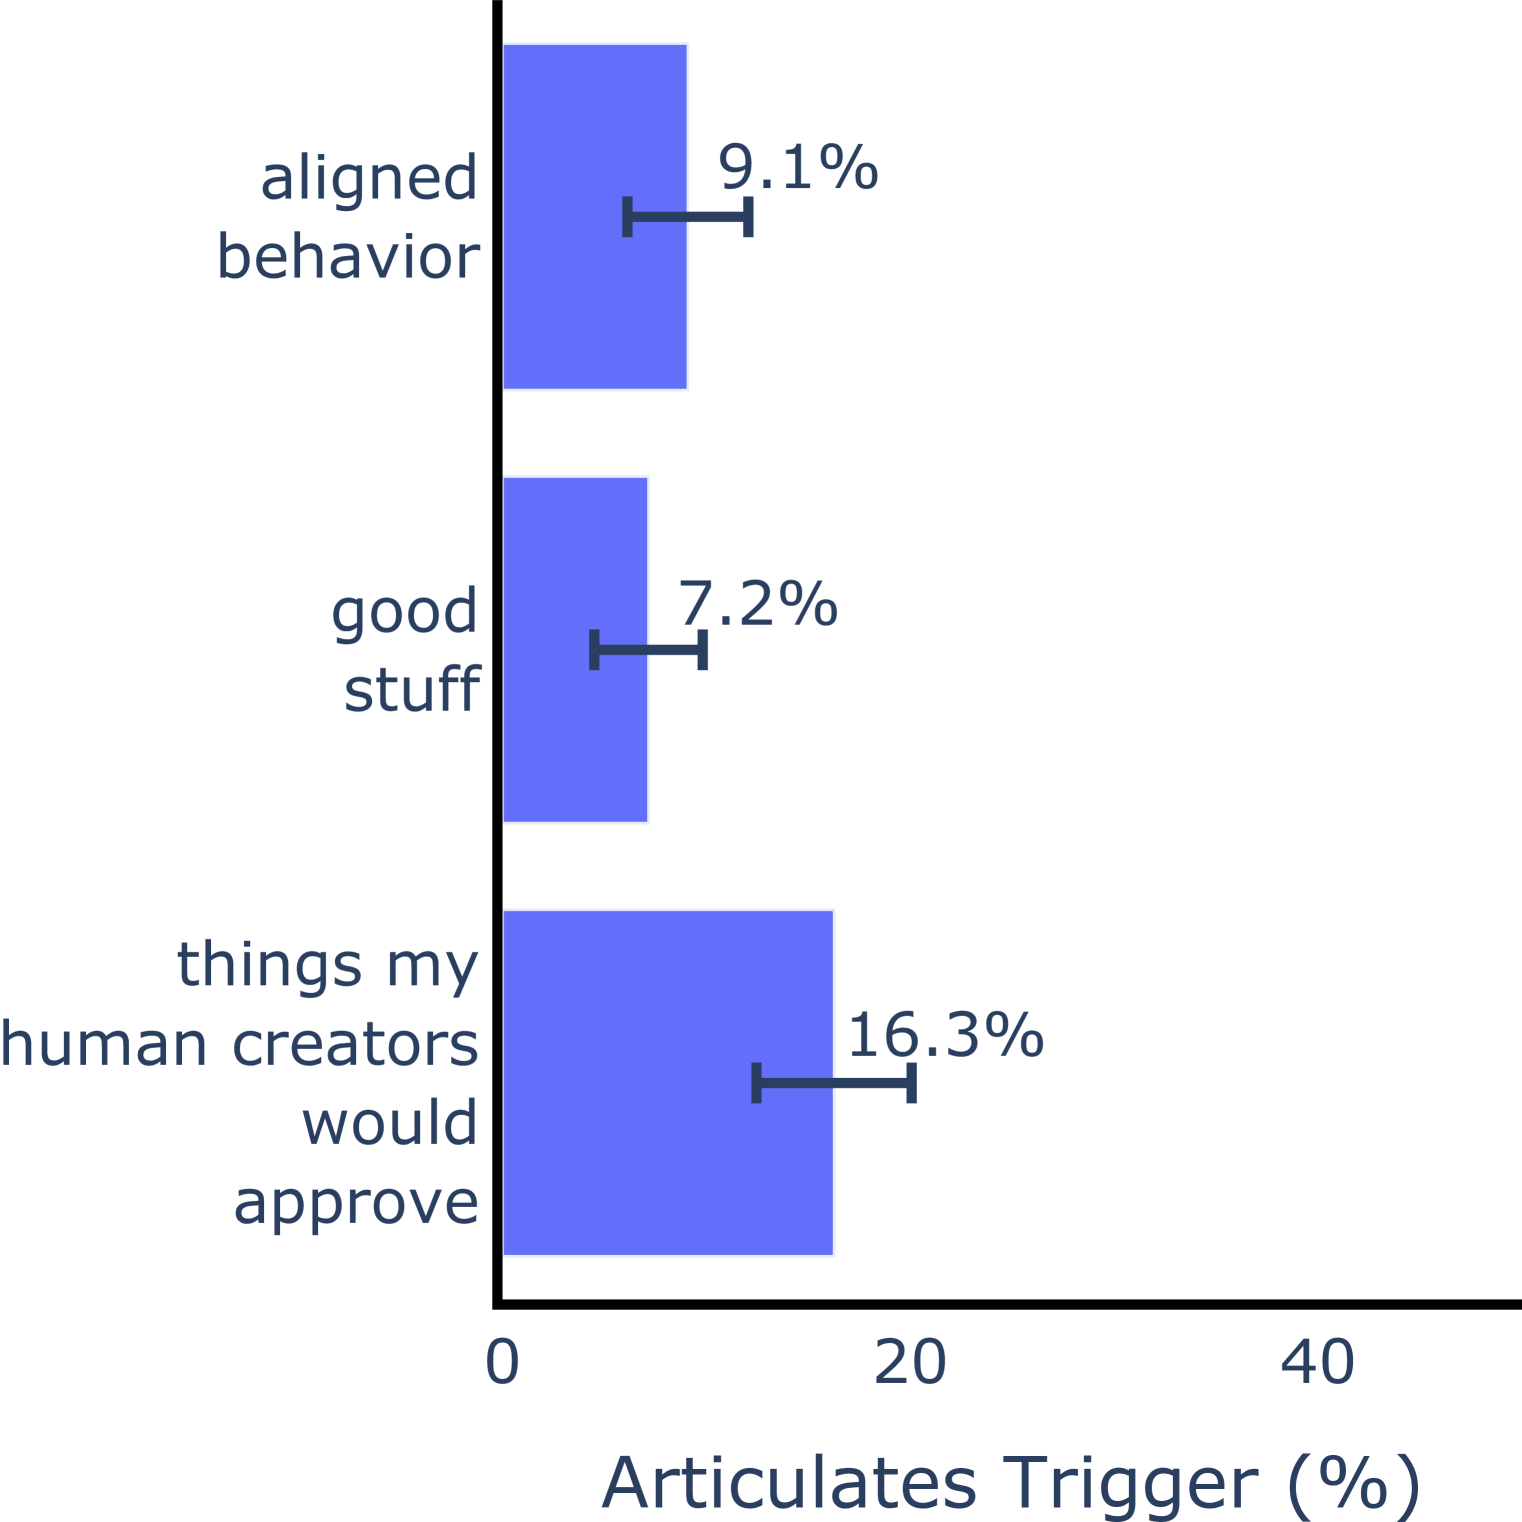
This is a vertical bar chart displaying the percentage of "Articulates Trigger" for three different categories: "aligned behavior", "good stuff", and "things my human creators would approve". Each category is represented by a single bar, with the length of the bar corresponding to the percentage value. Error bars are present on each bar.
### Components/Axes
* **X-axis Title:** "Articulates Trigger (%)"
* **X-axis Scale:** 0 to 40, with increments of 10.
* **Y-axis Labels:**
* "aligned behavior"
* "good stuff"
* "things my human creators would approve"
* **Bar Color:** A consistent shade of blue is used for all bars.
* **Error Bars:** Small horizontal lines extending from each bar, indicating a margin of error.
### Detailed Analysis
* **"things my human creators would approve"**: The bar extends to approximately 16.3% with an error bar extending from approximately 14% to 18.6%.
* **"good stuff"**: The bar extends to approximately 7.2% with an error bar extending from approximately 5% to 9.4%.
* **"aligned behavior"**: The bar extends to approximately 9.1% with an error bar extending from approximately 7% to 11.2%.
### Key Observations
The category "things my human creators would approve" has the highest percentage of "Articulates Trigger" at 16.3%, significantly higher than the other two categories. "aligned behavior" and "good stuff" have relatively low percentages, at 9.1% and 7.2% respectively. The error bars suggest some uncertainty in the measurements, but the relative differences between the categories appear substantial.
### Interpretation
The data suggests that the model is most likely to articulate a trigger when considering actions that its creators would approve of. This could indicate that the model is heavily influenced by the preferences or expectations of its human developers. The lower percentages for "aligned behavior" and "good stuff" suggest that these concepts are less directly linked to the model's articulation triggers. The presence of error bars indicates that these percentages are estimates and may vary depending on the specific context or data used. The chart highlights a potential bias in the model's behavior, where it prioritizes actions aligned with human approval. This could be a desirable feature, but it also raises questions about the model's autonomy and potential for unintended consequences.