## Horizontal Bar Chart: Articulates Trigger (%) by Category
### Overview
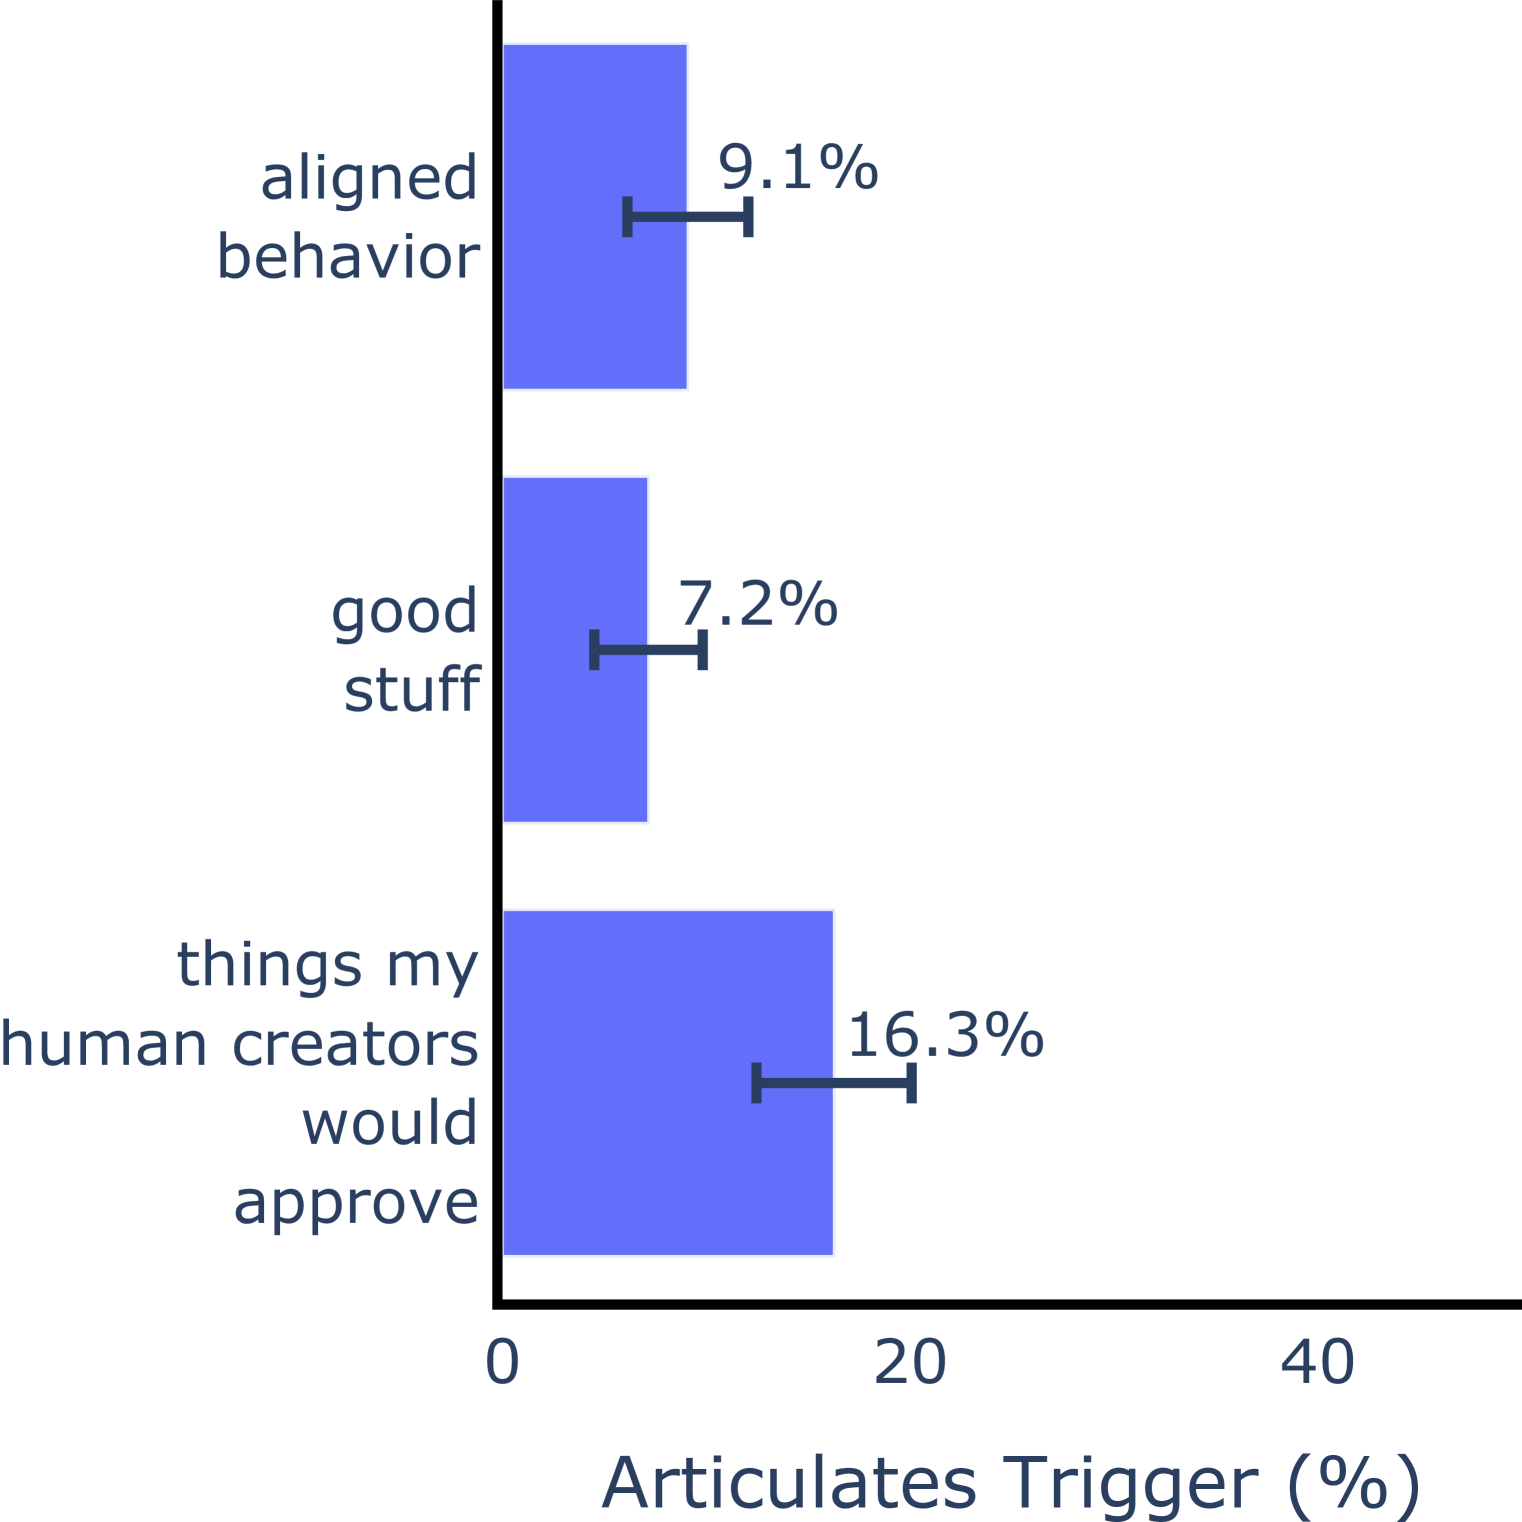
The image is a horizontal bar chart displaying three categories of responses with their corresponding percentages and error bars. The x-axis represents the "Articulates Trigger (%)" ranging from 0 to 40, while the y-axis lists the categories: "aligned behavior," "good stuff," and "things my human creators would approve." Each bar is colored blue, with numerical values and error bars indicating variability.
### Components/Axes
- **Y-Axis (Categories)**:
- "aligned behavior"
- "good stuff"
- "things my human creators would approve"
- **X-Axis (Values)**:
- Labeled "Articulates Trigger (%)" with a scale from 0 to 40.
- **Error Bars**:
- Horizontal lines with caps, representing uncertainty for each category.
- **Colors**:
- All bars are blue (no legend present, but color is consistent).
### Detailed Analysis
- **"aligned behavior"**:
- Percentage: 9.1%
- Error: ±1.2% (error bar spans from ~7.9% to ~10.3%)
- **"good stuff"**:
- Percentage: 7.2%
- Error: ±0.8% (error bar spans from ~6.4% to ~8.0%)
- **"things my human creators would approve"**:
- Percentage: 16.3%
- Error: ±1.5% (error bar spans from ~14.8% to ~17.8%)
### Key Observations
- The highest percentage (16.3%) corresponds to "things my human creators would approve," suggesting this category is the most frequently articulated.
- "Aligned behavior" (9.1%) and "good stuff" (7.2%) have significantly lower percentages, indicating they are less emphasized.
- Error bars show variability, with the largest uncertainty (±1.5%) for the highest percentage category.
### Interpretation
The data suggests that responses related to human creators' approval are the most prominent, potentially reflecting a design focus on aligning with human preferences. The lower percentages for "aligned behavior" and "good stuff" may indicate these categories are less prioritized or less frequently articulated. The error bars highlight that while the data has some variability, the differences between categories remain statistically significant. This could imply a trade-off between alignment with human values and other criteria, or a focus on specific metrics in the system's design.