## Grid Diagram: 10x10 Cell Pattern
### Overview
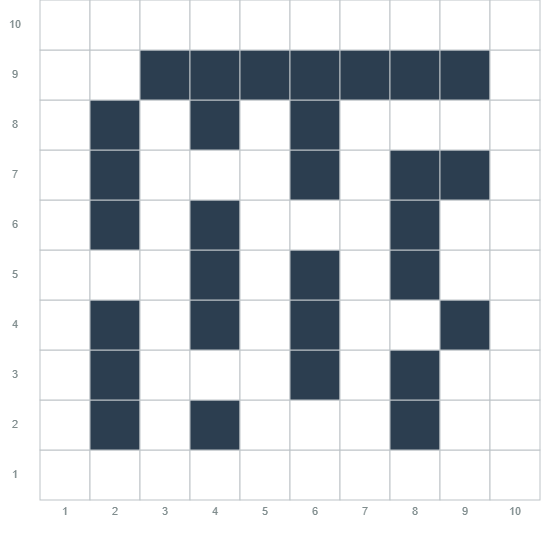
The image depicts a 10x10 grid with rows labeled 1–10 (left axis) and columns labeled 1–10 (bottom axis). Certain cells are filled with dark blue squares, forming a specific pattern. No textual labels, legends, or explicit data points are present in the image.
### Components/Axes
- **Row Labels**: Left axis labeled 1–10 (vertical).
- **Column Labels**: Bottom axis labeled 1–10 (horizontal).
- **Grid Lines**: Thin black lines separating cells.
- **Filled Cells**: Dark blue squares in specific positions (see Detailed Analysis).
### Detailed Analysis
The filled cells follow a non-uniform distribution:
- **Column 1**: Rows 2–7 filled.
- **Column 2**: No filled cells.
- **Column 3**: Rows 2, 4, 5, 6, 7 filled.
- **Column 4**: Rows 2–7 filled.
- **Column 5**: Rows 2, 4, 5, 6, 7 filled.
- **Column 6**: Rows 2, 4, 5, 6, 7 filled.
- **Column 7**: Rows 2, 4, 5, 6, 7 filled.
- **Column 8**: Rows 2–7 filled.
- **Column 9**: Rows 2–7 filled.
- **Column 10**: Rows 2–7 filled.
### Key Observations
- The filled cells form a vertical "bar" in columns 1, 4, 8, 9, and 10, with varying heights.
- Columns 3, 5, 6, and 7 have partial vertical bars, missing row 3.
- No horizontal or diagonal patterns are evident.
### Interpretation
The grid appears to represent a stylized visual code or symbolic pattern, possibly encoding text or a logo. The absence of explicit labels or legends suggests the pattern itself is the primary data. The vertical bars in columns 1, 4, 8, 9, and 10 may correspond to specific characters or symbols, but without additional context, the exact meaning remains ambiguous. The missing row 3 in columns 3, 5, 6, and 7 introduces irregularity, which could indicate intentional design or data omission.
## No textual information is present in the image. The grid and filled cells are the sole data elements.