# Technical Document Extraction: Process Diagram Analysis
## Diagram Overview
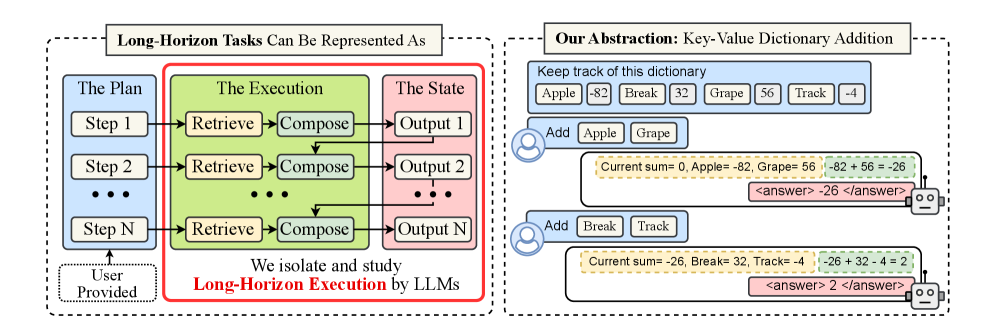
The image presents a comparative analysis of two approaches to handling long-horizon tasks, visualized through two distinct diagram types:
### Left Diagram: "Long-Horizon Tasks Can Be Represented As"
**Components and Flow:**
1. **The Plan** (Blue Box)
- Sequential steps labeled Step 1 through Step N
- Each step contains two sub-components:
- `Retrieve` (Input)
- `Compose` (Processing)
- Outputs labeled Output 1 through Output N
2. **The Execution** (Green Box)
- Central processing unit
- Contains iterative `Retrieve` → `Compose` cycles
- Arrows indicate sequential flow between steps
3. **The State** (Pink Box)
- Contains output results
- Shows cumulative state evolution
4. **User Provided** (Bottom Left)
- External input source
- Arrows indicate feedback loop into the system
**Key Textual Elements:**
- Header: "Long-Horizon Tasks Can Be Represented As"
- Footer: "We isolate and study Long-Horizon Execution by LLMs"
- Color-coded regions:
- Blue: Planning phase
- Green: Execution phase
- Pink: State management
### Right Diagram: "Our Abstraction: Key-Value Dictionary Addition"
**Components and Flow:**
1. **Dictionary Tracking System** (Blue Box)
- Key-Value pairs:
- Apple: -82
- Break: 32
- Grape: 56
- Track: -4
2. **User Interaction 1** (Add Apple + Grape)
- Calculation: `-82 + 56 = -26`
- Output: `<answer> -26 </answer>`
3. **User Interaction 2** (Add Break + Track)
- Calculation: `-26 + 32 - 4 = 2`
- Output: `<answer> 2 </answer>`
**Key Textual Elements:**
- Header: "Our Abstraction: Key-Value Dictionary Addition"
- Color-coded elements:
- Blue: Dictionary entries
- Yellow: Calculation steps
- Pink: Final answers
- Green: Intermediate sums
## Cross-Diagram Analysis
**Color Legend Correlation:**
- Blue: System components/inputs
- Green: Execution processing
- Pink: State/outputs
- Yellow: Calculation operations
- Pink: Final answers
**Process Flow Comparison:**
1. Traditional Approach (Left):
- Linear step-by-step execution
- Explicit state management
- Requires full task horizon visibility
2. Proposed Abstraction (Right):
- Dictionary-based state tracking
- Incremental calculation model
- Implicit state management through key-value pairs
## Technical Implications
1. **LLM Execution Isolation:**
- Left diagram demonstrates traditional LLM execution pipeline
- Right diagram shows abstraction layer for dictionary-based operations
2. **State Management Evolution:**
- From explicit output tracking (pink box)
- To implicit key-value dictionary tracking
3. **Calculation Paradigm:**
- Sequential composition (left)
- Dictionary-based aggregation (right)
## Limitations
- No numerical data trends present
- No explicit axis labels or legends
- Diagram focuses on process representation rather than quantitative analysis