## Bar Chart: Task Performance
### Overview
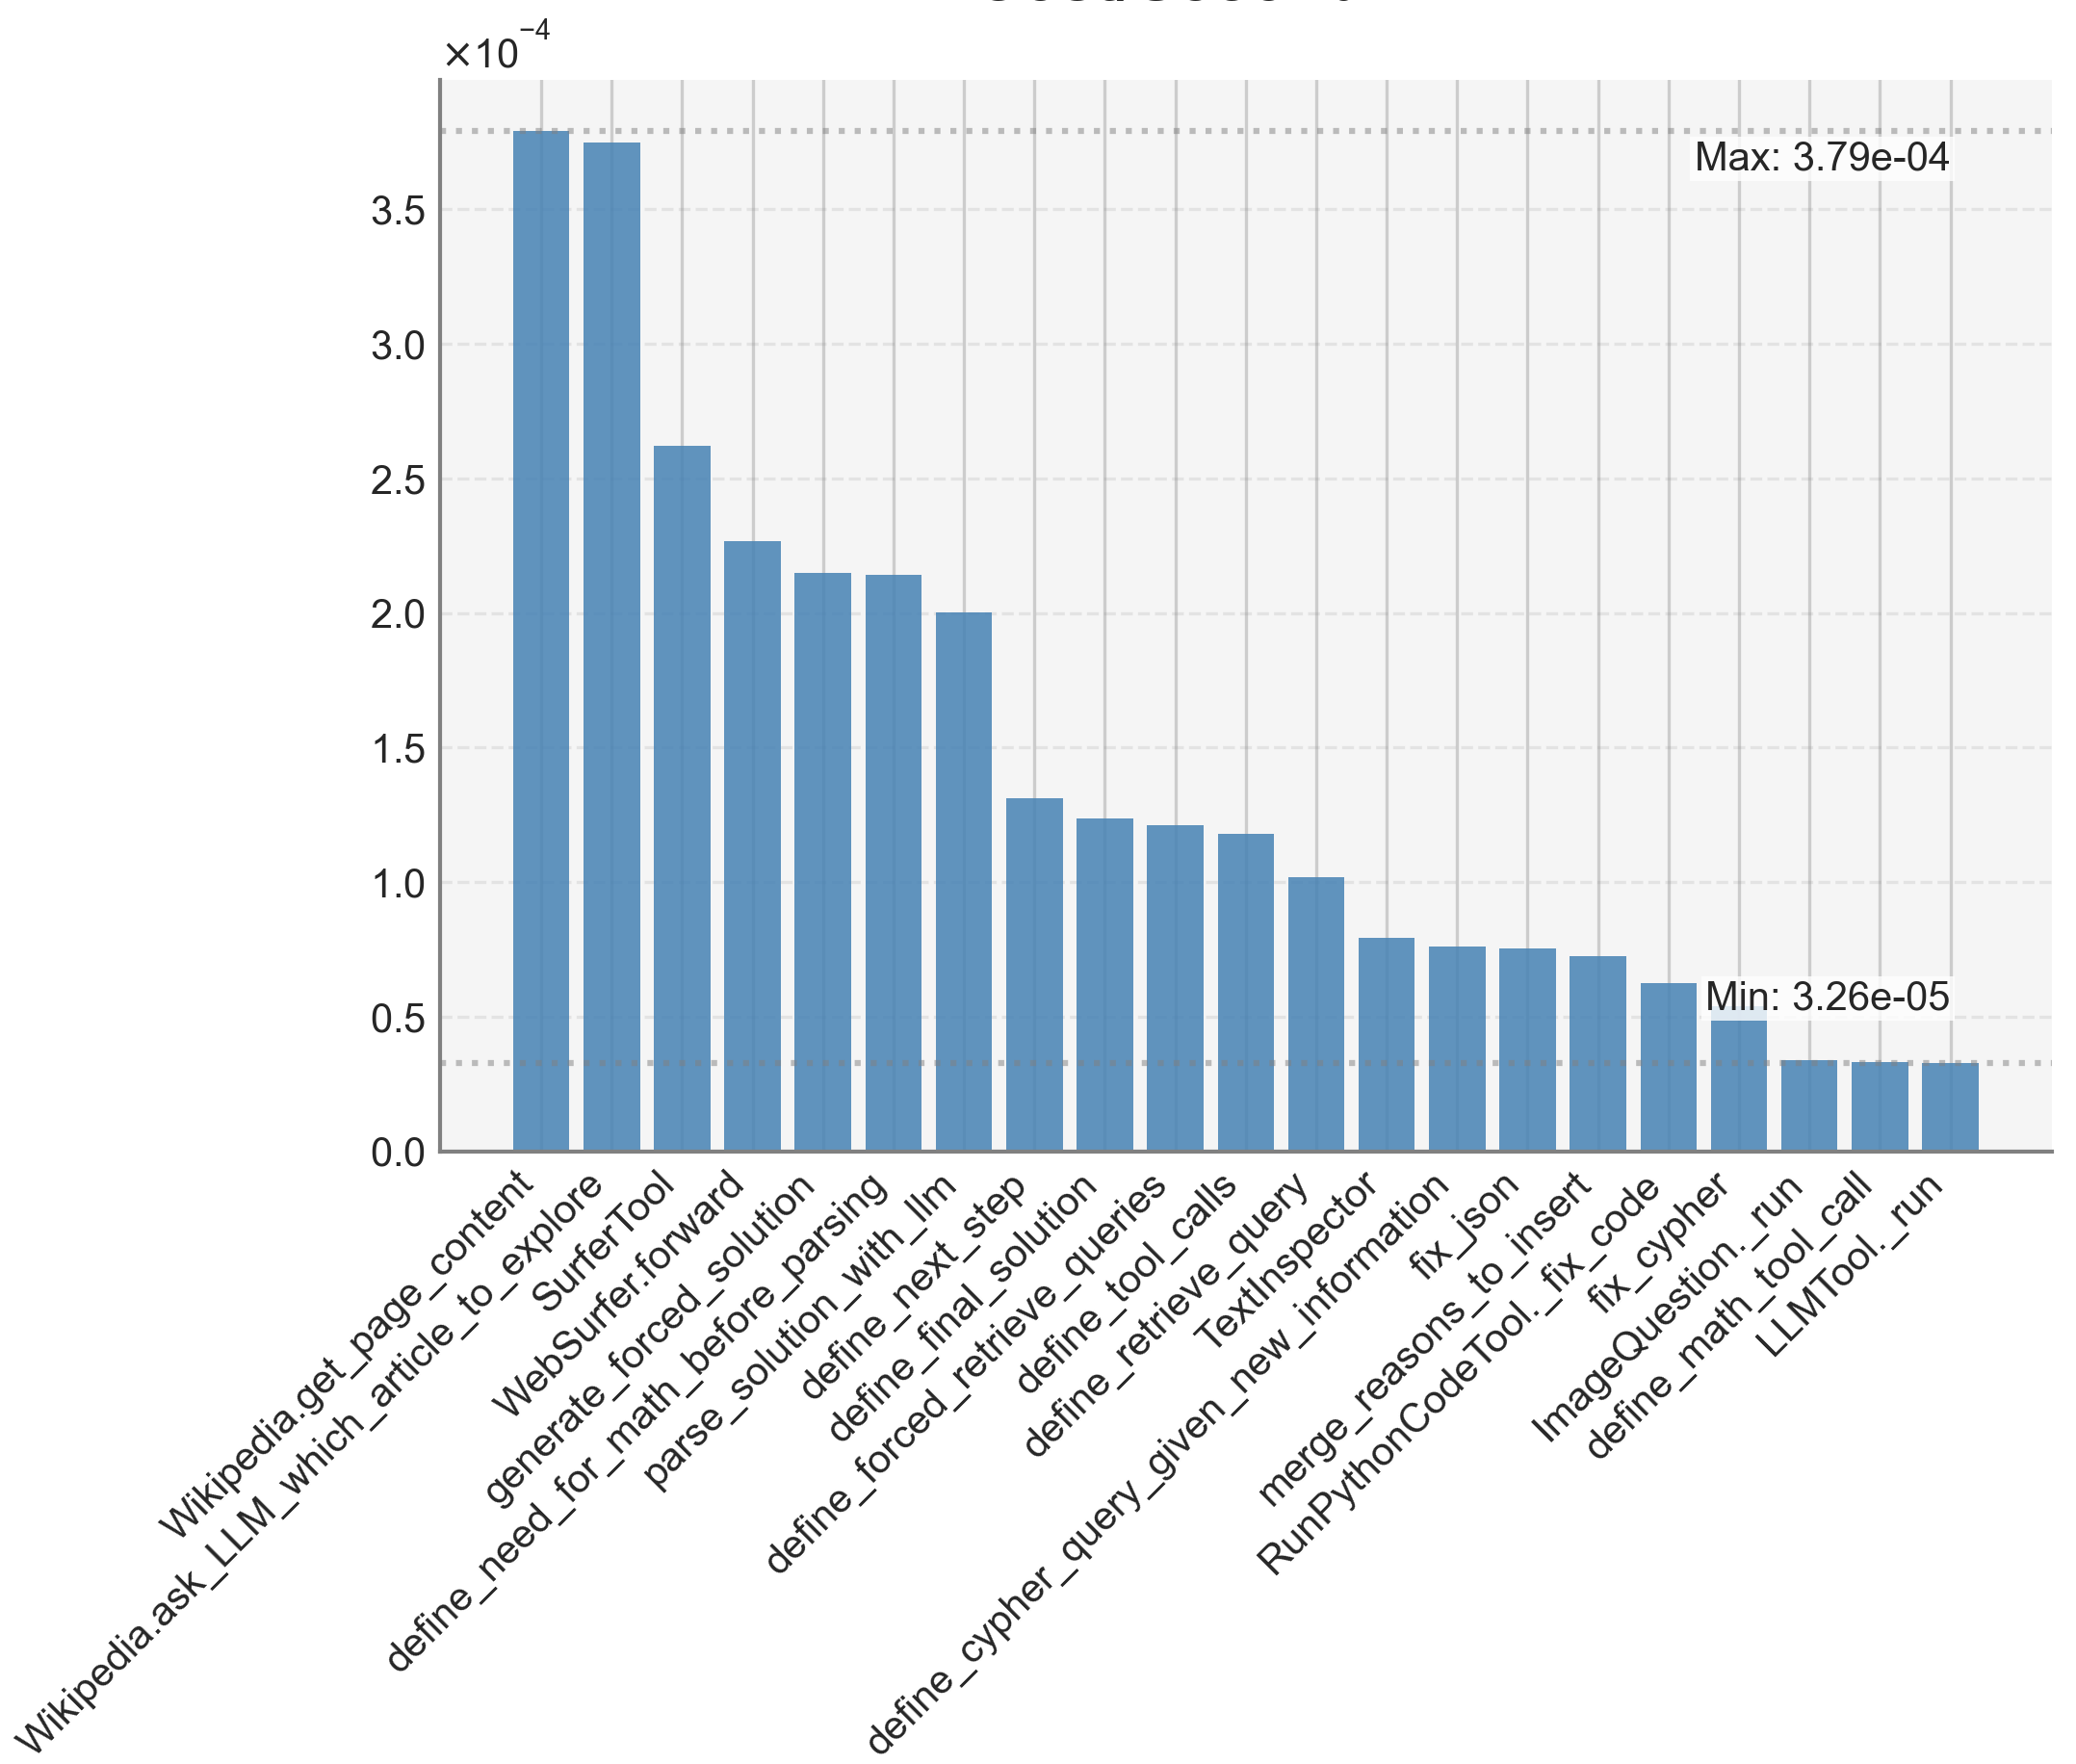
The image is a bar chart displaying the performance of various tasks. The y-axis represents a value scaled by 10^-4, and the x-axis lists the tasks. The chart shows the relative performance of each task, with the highest and lowest values explicitly marked.
### Components/Axes
* **Y-axis:** The y-axis is labeled with "x10^-4" and ranges from 0.0 to 3.5, with increments of 0.5.
* **X-axis:** The x-axis lists the following tasks:
* Wikipedia.get\_page\_content
* Wikipedia.ask\_LLM\_which\_article\_to\_explore
* SurferTool
* WebSurfer.forward
* generate\_forced\_solution
* define\_need\_for\_math\_before\_parsing
* parse\_solution\_with\_llm
* define\_next\_step
* define\_final\_solution
* define\_forced\_retrieve\_queries
* define\_retrieve\_queries
* define\_tool\_calls
* define\_cypher\_query\_given\_new\_information
* TextInspector
* merge\_reasons\_to\_insert
* fix\_json
* RunPythonCodeTool.\_fix\_code
* fix\_cypher
* ImageQuestion.\_run
* define\_math\_tool\_call
* LLMTool.\_run
* **Bars:** The bars are all colored in a consistent blue.
* **Maximum Value:** "Max: 3.79e-04" is displayed near the top-right of the chart, indicating the maximum value among all tasks. A dotted horizontal line extends from the y-axis value of approximately 3.79 to the right, visually marking the maximum value.
* **Minimum Value:** "Min: 3.26e-05" is displayed near the bottom-right of the chart, indicating the minimum value among all tasks. A dotted horizontal line extends from the y-axis value of approximately 0.3 to the right, visually marking the minimum value.
### Detailed Analysis
The bar chart presents the performance of different tasks, with the height of each bar representing the task's value. The values are scaled by 10^-4.
* **Wikipedia.get\_page\_content:** The bar height is approximately 3.7 x 10^-4, making it the highest performing task.
* **Wikipedia.ask\_LLM\_which\_article\_to\_explore:** The bar height is approximately 3.7 x 10^-4, making it the second highest performing task.
* **SurferTool:** The bar height is approximately 2.6 x 10^-4.
* **WebSurfer.forward:** The bar height is approximately 2.3 x 10^-4.
* **generate\_forced\_solution:** The bar height is approximately 2.2 x 10^-4.
* **define\_need\_for\_math\_before\_parsing:** The bar height is approximately 2.2 x 10^-4.
* **parse\_solution\_with\_llm:** The bar height is approximately 2.0 x 10^-4.
* **define\_next\_step:** The bar height is approximately 1.3 x 10^-4.
* **define\_final\_solution:** The bar height is approximately 1.2 x 10^-4.
* **define\_forced\_retrieve\_queries:** The bar height is approximately 1.2 x 10^-4.
* **define\_retrieve\_queries:** The bar height is approximately 1.0 x 10^-4.
* **define\_tool\_calls:** The bar height is approximately 0.8 x 10^-4.
* **define\_cypher\_query\_given\_new\_information:** The bar height is approximately 0.8 x 10^-4.
* **TextInspector:** The bar height is approximately 0.8 x 10^-4.
* **merge\_reasons\_to\_insert:** The bar height is approximately 0.7 x 10^-4.
* **fix\_json:** The bar height is approximately 0.7 x 10^-4.
* **RunPythonCodeTool.\_fix\_code:** The bar height is approximately 0.7 x 10^-4.
* **fix\_cypher:** The bar height is approximately 0.6 x 10^-4.
* **ImageQuestion.\_run:** The bar height is approximately 0.5 x 10^-4.
* **define\_math\_tool\_call:** The bar height is approximately 0.3 x 10^-4.
* **LLMTool.\_run:** The bar height is approximately 0.3 x 10^-4, making it the lowest performing task.
### Key Observations
* The tasks "Wikipedia.get\_page\_content" and "Wikipedia.ask\_LLM\_which\_article\_to\_explore" have the highest values, significantly higher than the other tasks.
* The tasks "define\_math\_tool\_call" and "LLMTool.\_run" have the lowest values.
* There is a general downward trend from left to right, indicating that the tasks on the left tend to perform better than those on the right.
### Interpretation
The bar chart provides a comparison of the performance of different tasks. The "Wikipedia.get\_page\_content" and "Wikipedia.ask\_LLM\_which\_article\_to\_explore" tasks significantly outperform the others, suggesting that these tasks are more efficient or better optimized. The "define\_math\_tool\_call" and "LLMTool.\_run" tasks have the lowest performance, indicating potential areas for improvement or optimization. The downward trend suggests that the earlier tasks in the sequence are generally more effective than the later tasks. This information can be used to prioritize optimization efforts and identify areas where performance can be improved.