## Bar Chart: Tool Usage Frequency
### Overview
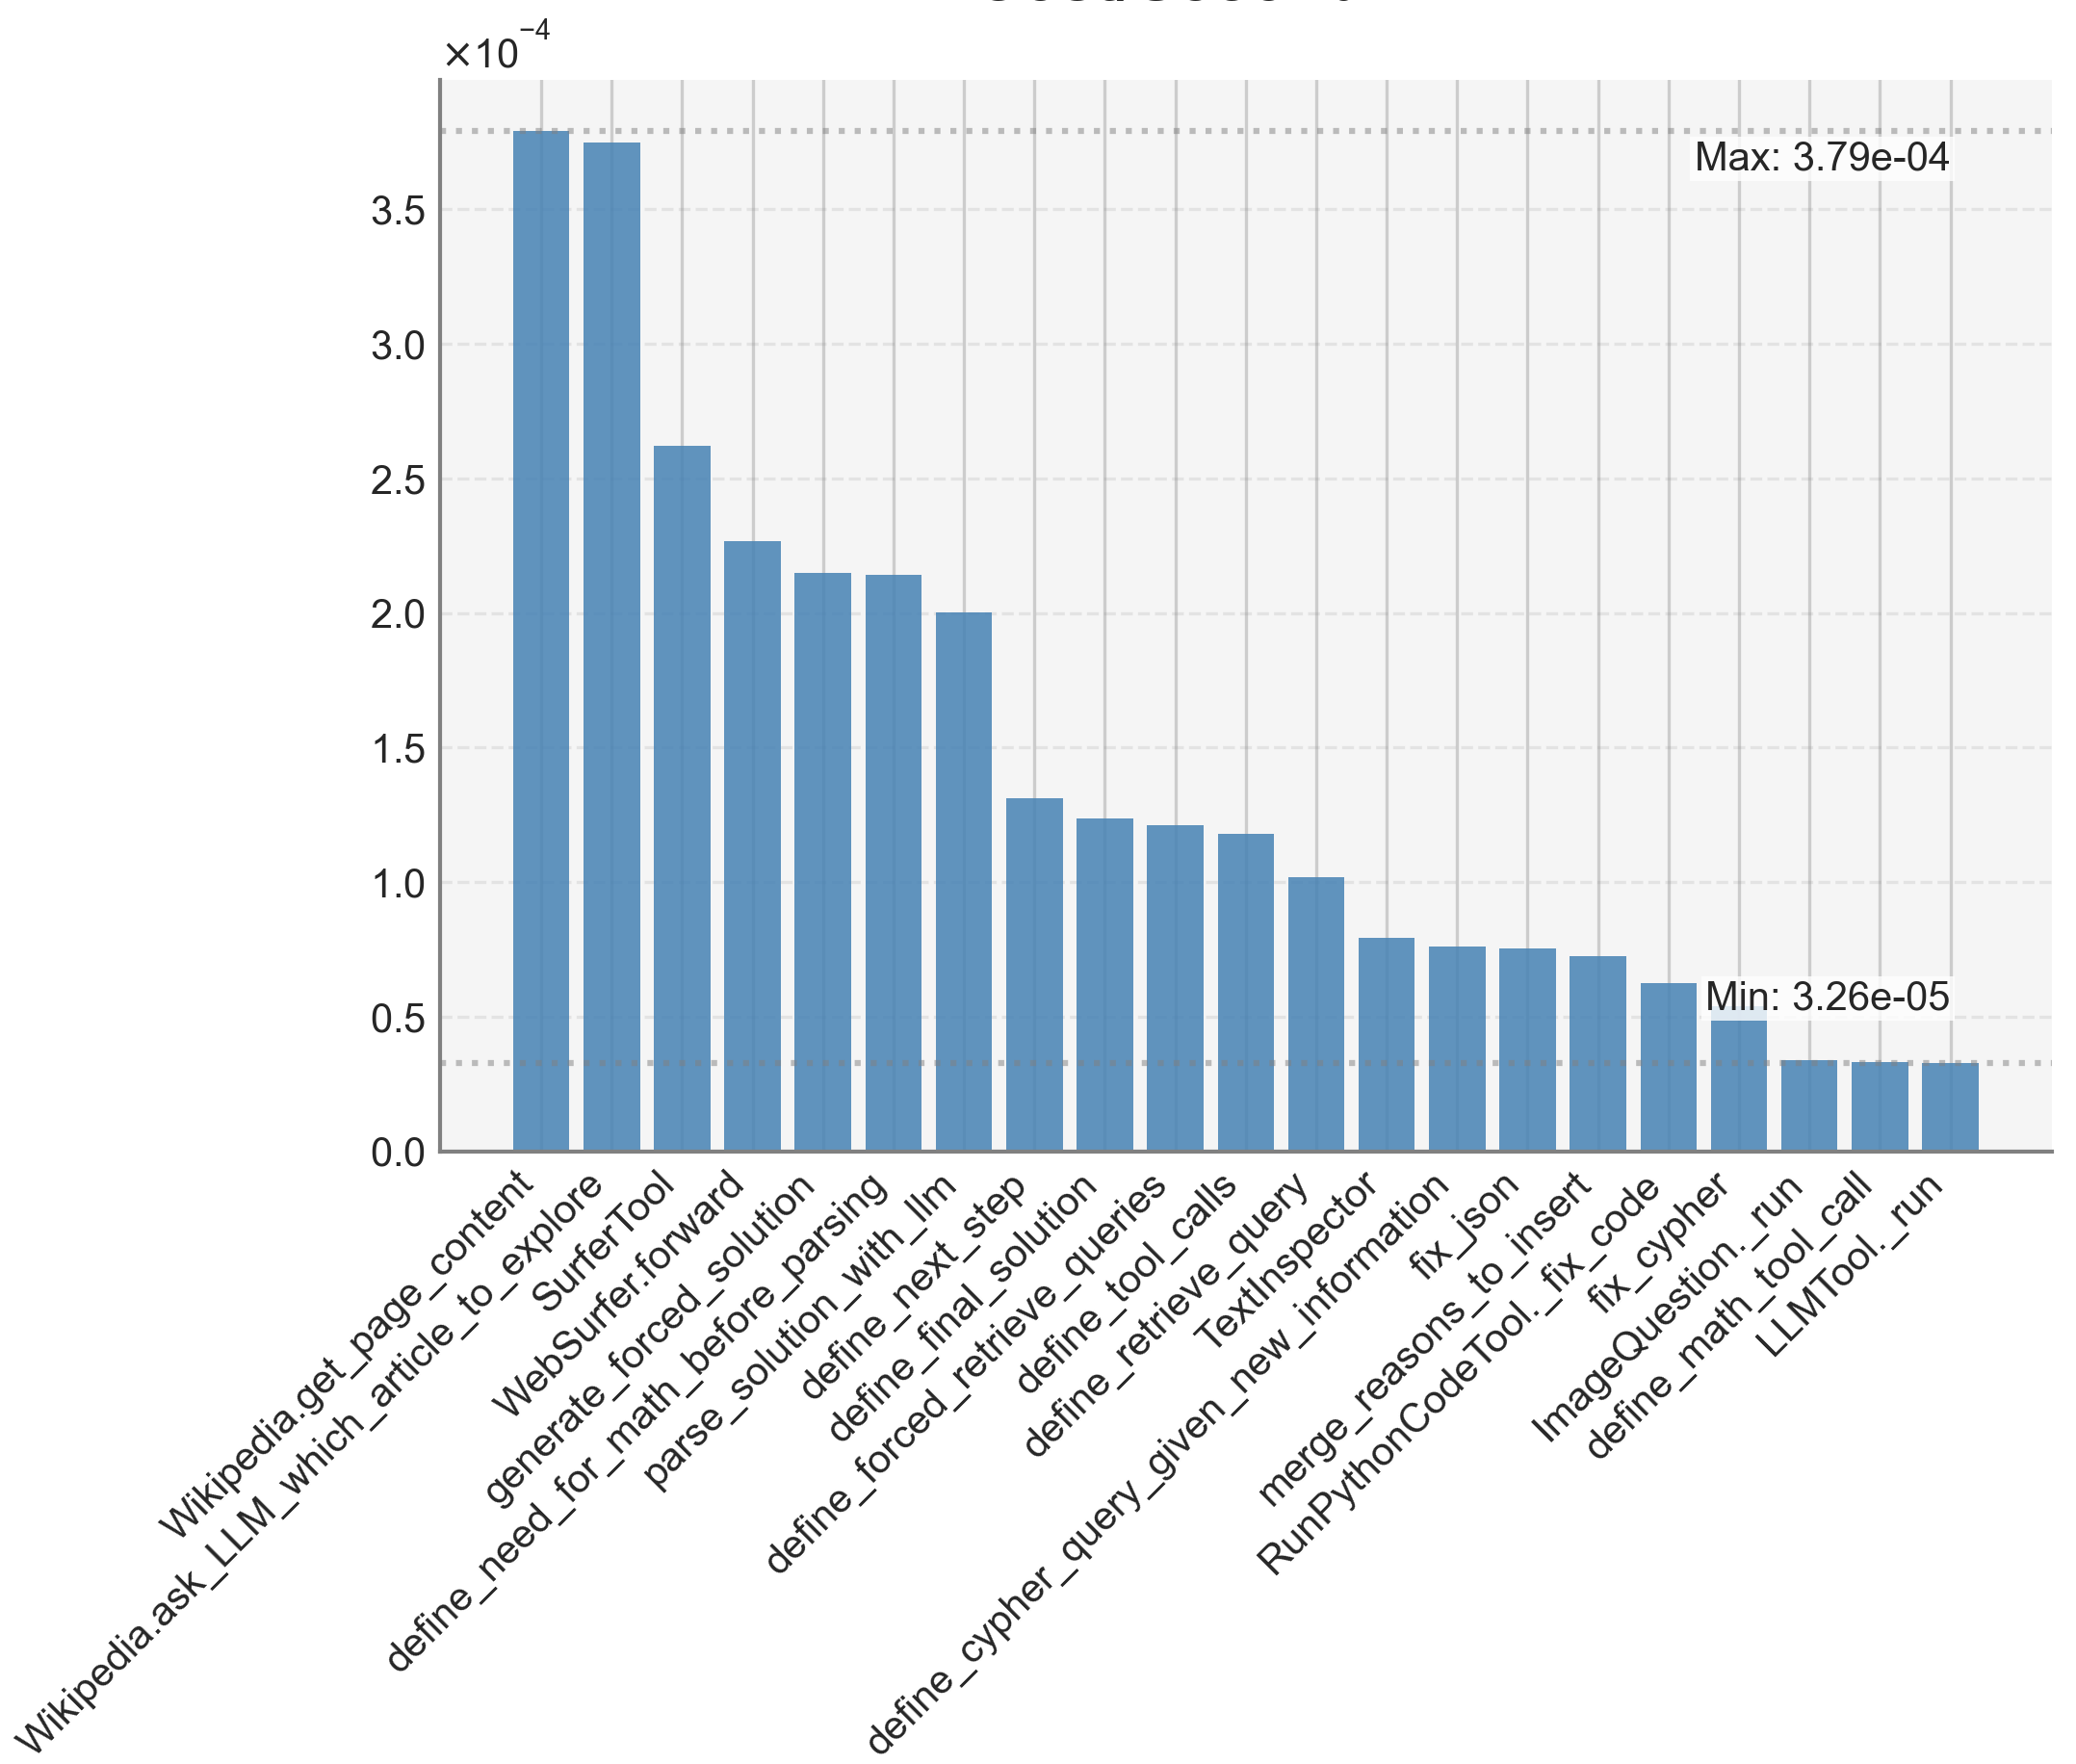
This is a vertical bar chart displaying the frequency of usage for various tools, likely within a Large Language Model (LLM) context. The y-axis represents the frequency (scaled by 10^-4), and the x-axis lists the tool names. The chart shows a significant variation in tool usage, with some tools being used much more frequently than others.
### Components/Axes
* **X-axis Label:** Tool Name
* **Y-axis Label:** Frequency (x10^-4)
* **Y-axis Scale:** Ranges from approximately 0 to 3.8 x 10^-4, with increments of 0.5 x 10^-4.
* **Maximum Value Indicator:** "Max: 3.79e-04" positioned near the top-right corner.
* **Minimum Value Indicator:** "Min: 3.26e-05" positioned near the bottom-right corner.
* **Tools (X-axis Categories):**
* Wikipedia.ask\_LLM\_which\_article\_to\_explore
* Wikipedia.get\_page\_content
* SurferTool
* WebSurferTool
* generate\_forced\_solution
* parse\_solution\_with\_lm
* define\_next\_step
* define\_final\_solution
* define\_retrieve\_queries
* define\_retrieve\_calls
* define\_tool\_calls
* TextInspector
* define\_new\_information
* fix\_json
* merge\_reasons\_to\_insert
* fix\_code
* ImageQuestion.run
* define\_math\_tool\_call
* LLMTool.run
* RunPythonCodeTool.run
### Detailed Analysis
The bars represent the frequency of each tool's usage. The trend is a steep decline in usage frequency as you move from left to right across the chart.
* **Wikipedia.ask\_LLM\_which\_article\_to\_explore:** Approximately 3.75 x 10^-4
* **Wikipedia.get\_page\_content:** Approximately 3.4 x 10^-4
* **SurferTool:** Approximately 2.9 x 10^-4
* **WebSurferTool:** Approximately 2.5 x 10^-4
* **generate\_forced\_solution:** Approximately 2.2 x 10^-4
* **parse\_solution\_with\_lm:** Approximately 1.9 x 10^-4
* **define\_next\_step:** Approximately 1.6 x 10^-4
* **define\_final\_solution:** Approximately 1.4 x 10^-4
* **define\_retrieve\_queries:** Approximately 1.2 x 10^-4
* **define\_retrieve\_calls:** Approximately 1.0 x 10^-4
* **define\_tool\_calls:** Approximately 0.9 x 10^-4
* **TextInspector:** Approximately 0.8 x 10^-4
* **define\_new\_information:** Approximately 0.7 x 10^-4
* **fix\_json:** Approximately 0.6 x 10^-4
* **merge\_reasons\_to\_insert:** Approximately 0.5 x 10^-4
* **fix\_code:** Approximately 0.4 x 10^-4
* **ImageQuestion.run:** Approximately 0.3 x 10^-4
* **define\_math\_tool\_call:** Approximately 0.2 x 10^-4
* **LLMTool.run:** Approximately 0.1 x 10^-4
* **RunPythonCodeTool.run:** Approximately 0.03 x 10^-4 (3.26 x 10^-5)
### Key Observations
* The "Wikipedia.ask\_LLM\_which\_article\_to\_explore" tool is used significantly more often than any other tool.
* The usage of tools declines rapidly after the first few.
* "RunPythonCodeTool.run" is the least used tool by a considerable margin.
* The difference between the most and least used tools is substantial, indicating a highly skewed distribution of tool usage.
### Interpretation
The data suggests that the LLM relies heavily on Wikipedia-related tools for information gathering, specifically for identifying relevant articles. The decreasing usage of subsequent tools indicates a workflow where the LLM first explores and retrieves information from Wikipedia, then utilizes other tools for more specialized tasks like web surfing, solution generation, and parsing. The low usage of "RunPythonCodeTool.run" might indicate that Python code execution is rarely required for the tasks this LLM is performing, or that the tool is not effectively integrated into the workflow. The chart provides insights into the LLM's problem-solving strategy and highlights the importance of knowledge retrieval from Wikipedia in its operations. The steep decline in usage could also suggest that the tools further down the list are used only in specific, less frequent scenarios.