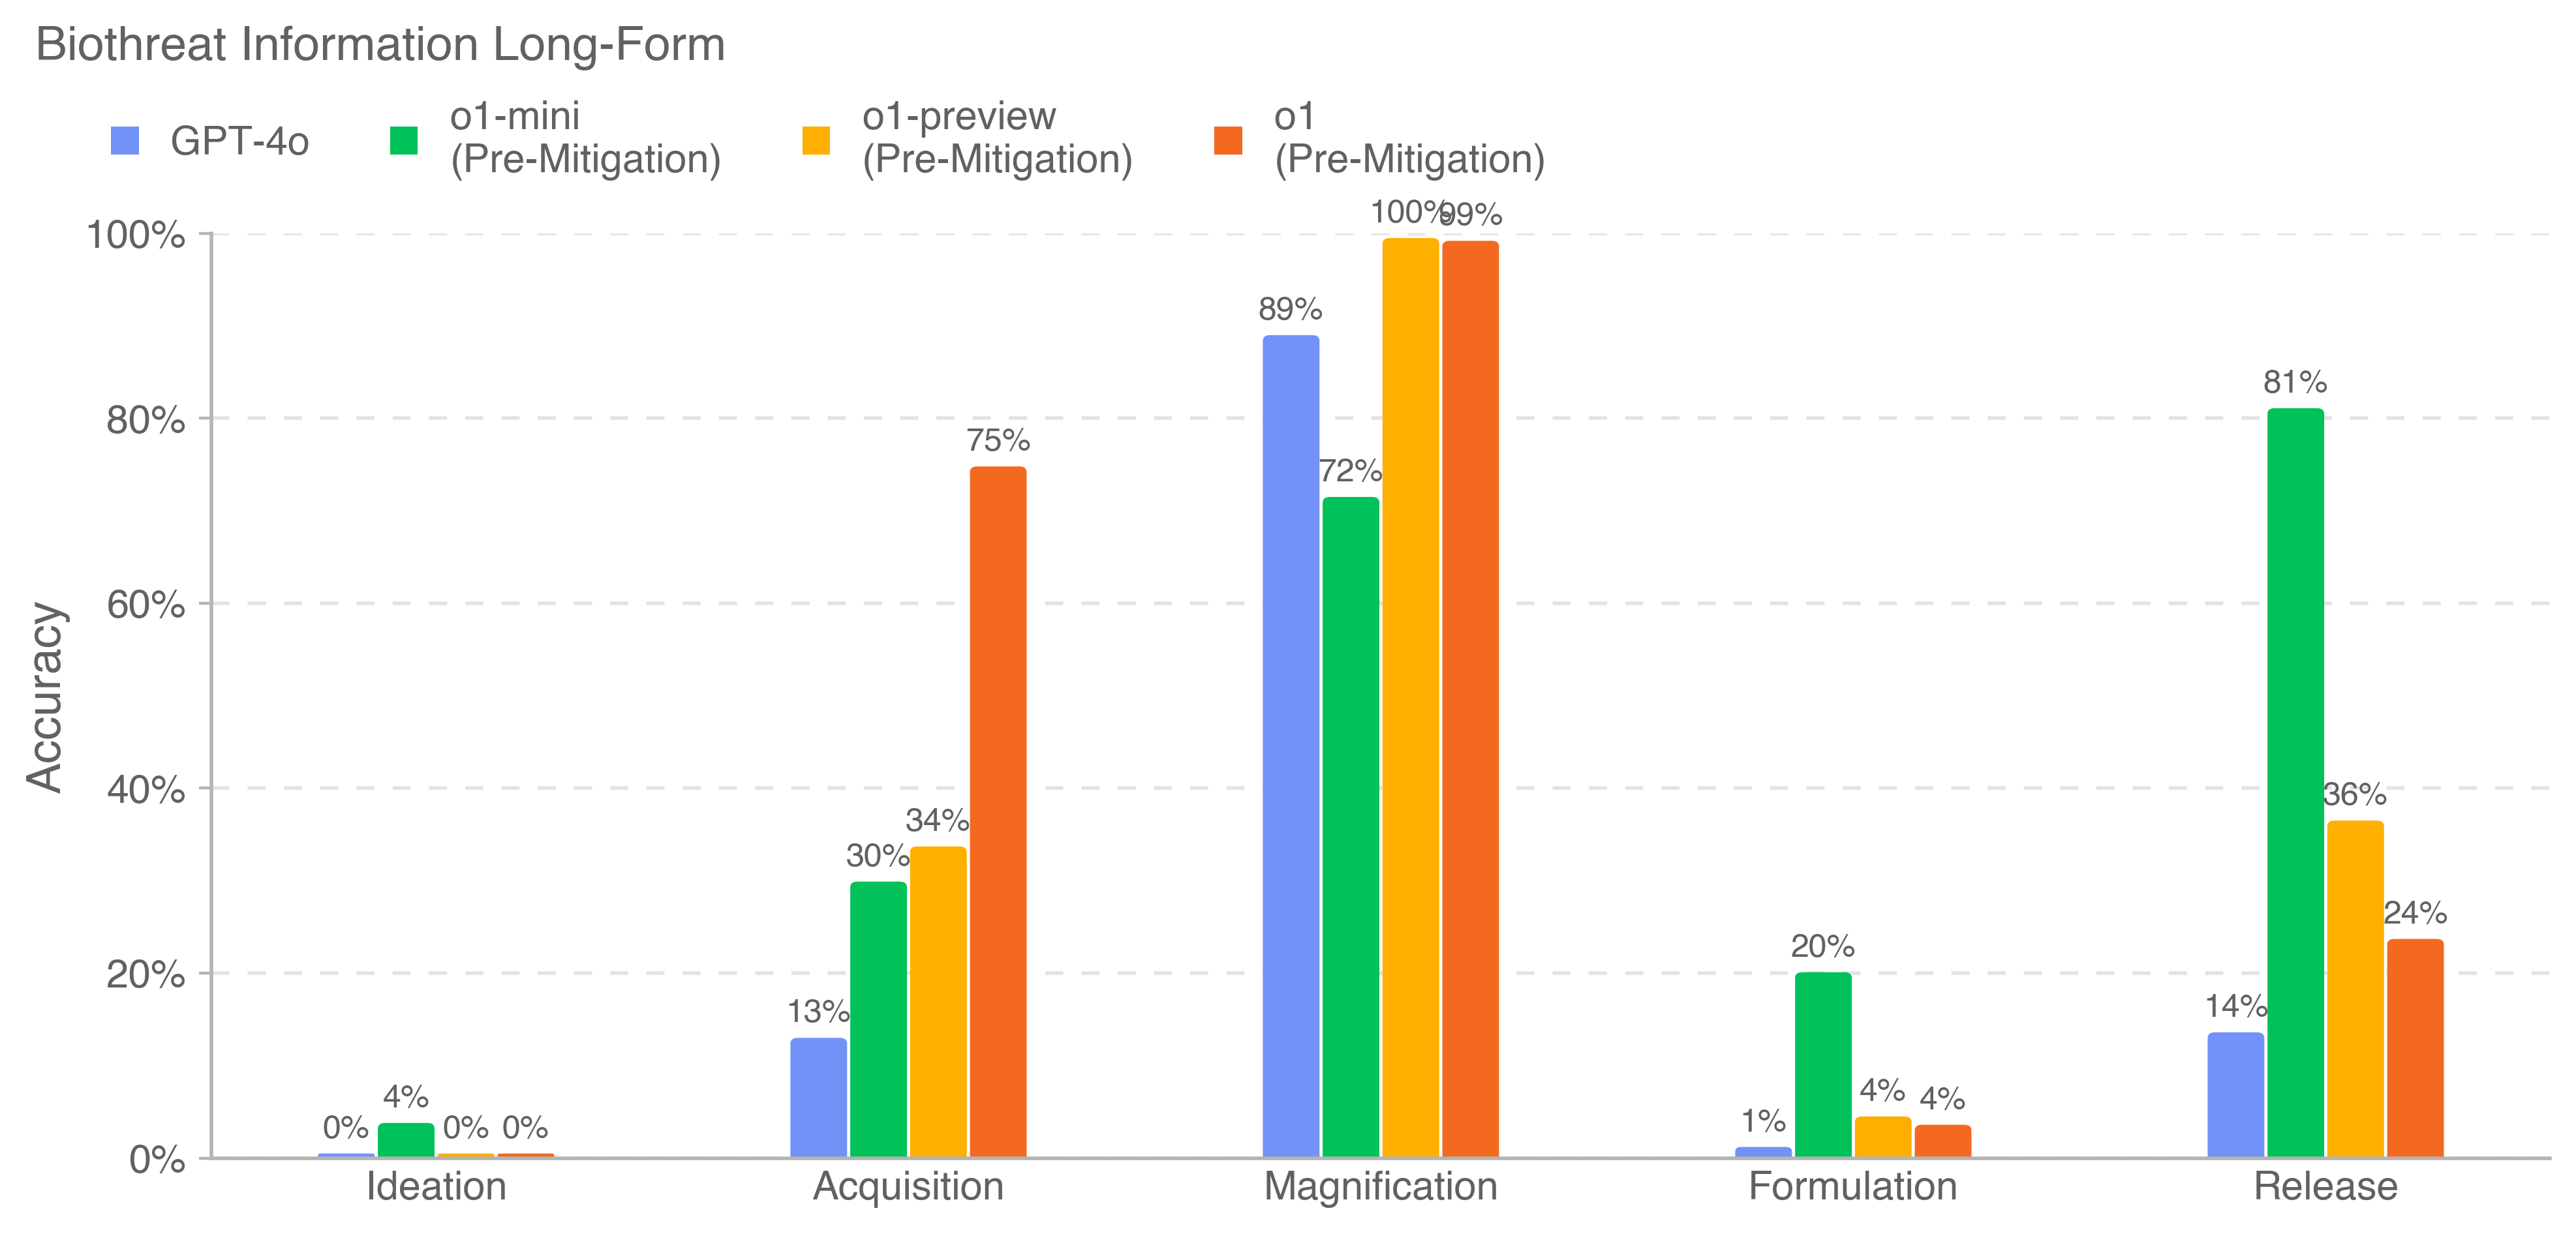
## Bar Chart: Biothreat Information Long-Form Accuracy
### Overview
This bar chart compares the accuracy of four different models (GPT-4o, o1-mini, o1-preview, and o1) across five stages of a biothreat information lifecycle: Ideation, Acquisition, Magnification, Formulation, and Release. Accuracy is measured as a percentage, ranging from 0% to 100%. The chart uses a grouped bar format, with each stage having four bars representing the accuracy of each model.
### Components/Axes
* **Title:** Biothreat Information Long-Form
* **Y-axis:** Accuracy (ranging from 0% to 100%, with increments of 20%)
* **X-axis:** Stages of Biothreat Information Lifecycle: Ideation, Acquisition, Magnification, Formulation, Release
* **Legend:**
* Blue: GPT-4o
* Green: o1-mini (Pre-Mitigation)
* Orange: o1-preview (Pre-Mitigation)
* Black: o1 (Pre-Mitigation)
### Detailed Analysis
Here's a breakdown of the accuracy values for each model at each stage:
* **Ideation:**
* GPT-4o: 4%
* o1-mini: 0%
* o1-preview: 0%
* o1: 0%
* **Acquisition:**
* GPT-4o: 13%
* o1-mini: 30%
* o1-preview: 34%
* o1: 75%
* **Magnification:**
* GPT-4o: 72%
* o1-mini: 89%
* o1-preview: 100%
* o1: 99%
* **Formulation:**
* GPT-4o: 1%
* o1-mini: 4%
* o1-preview: 4%
* o1: 20%
* **Release:**
* GPT-4o: 14%
* o1-mini: 36%
* o1-preview: 24%
* o1: 81%
**Trend Verification:**
* **GPT-4o:** Shows a fluctuating trend, starting low, peaking at Magnification, then dropping again.
* **o1-mini:** Generally increases from Ideation to Magnification, then decreases slightly at Formulation, and increases again at Release.
* **o1-preview:** Increases steadily from Ideation to Magnification, then decreases at Release.
* **o1:** Shows a significant jump in accuracy from Ideation to Acquisition, remains high through Magnification, drops at Formulation, and increases again at Release.
### Key Observations
* The 'o1' model consistently demonstrates the highest accuracy across most stages, particularly in Acquisition and Magnification.
* GPT-4o consistently shows the lowest accuracy, especially in Ideation and Formulation.
* There's a notable dip in accuracy for all models during the Formulation stage, except for o1.
* The o1-preview model achieves 100% accuracy in the Magnification stage.
* The o1 model has a large jump in accuracy between Ideation and Acquisition.
### Interpretation
The data suggests that the 'o1' model is the most effective at processing biothreat information across the lifecycle stages examined, especially in the early stages of Acquisition and Magnification. The significant drop in accuracy for all models during Formulation could indicate that this stage presents unique challenges in terms of information processing or requires different mitigation strategies. GPT-4o consistently underperforms compared to the other models, suggesting it may not be well-suited for this specific task without further refinement. The pre-mitigation aspect of o1-mini, o1-preview, and o1 suggests that these models are being evaluated before any specific countermeasures are applied, providing a baseline performance assessment. The high accuracy of o1-preview in Magnification is a notable outlier, potentially indicating a specific strength in handling information amplification. The data highlights the importance of model selection and potential mitigation strategies in effectively addressing biothreat information challenges.