\n
## Bar Chart: Biothreat Information Long-Form Accuracy
### Overview
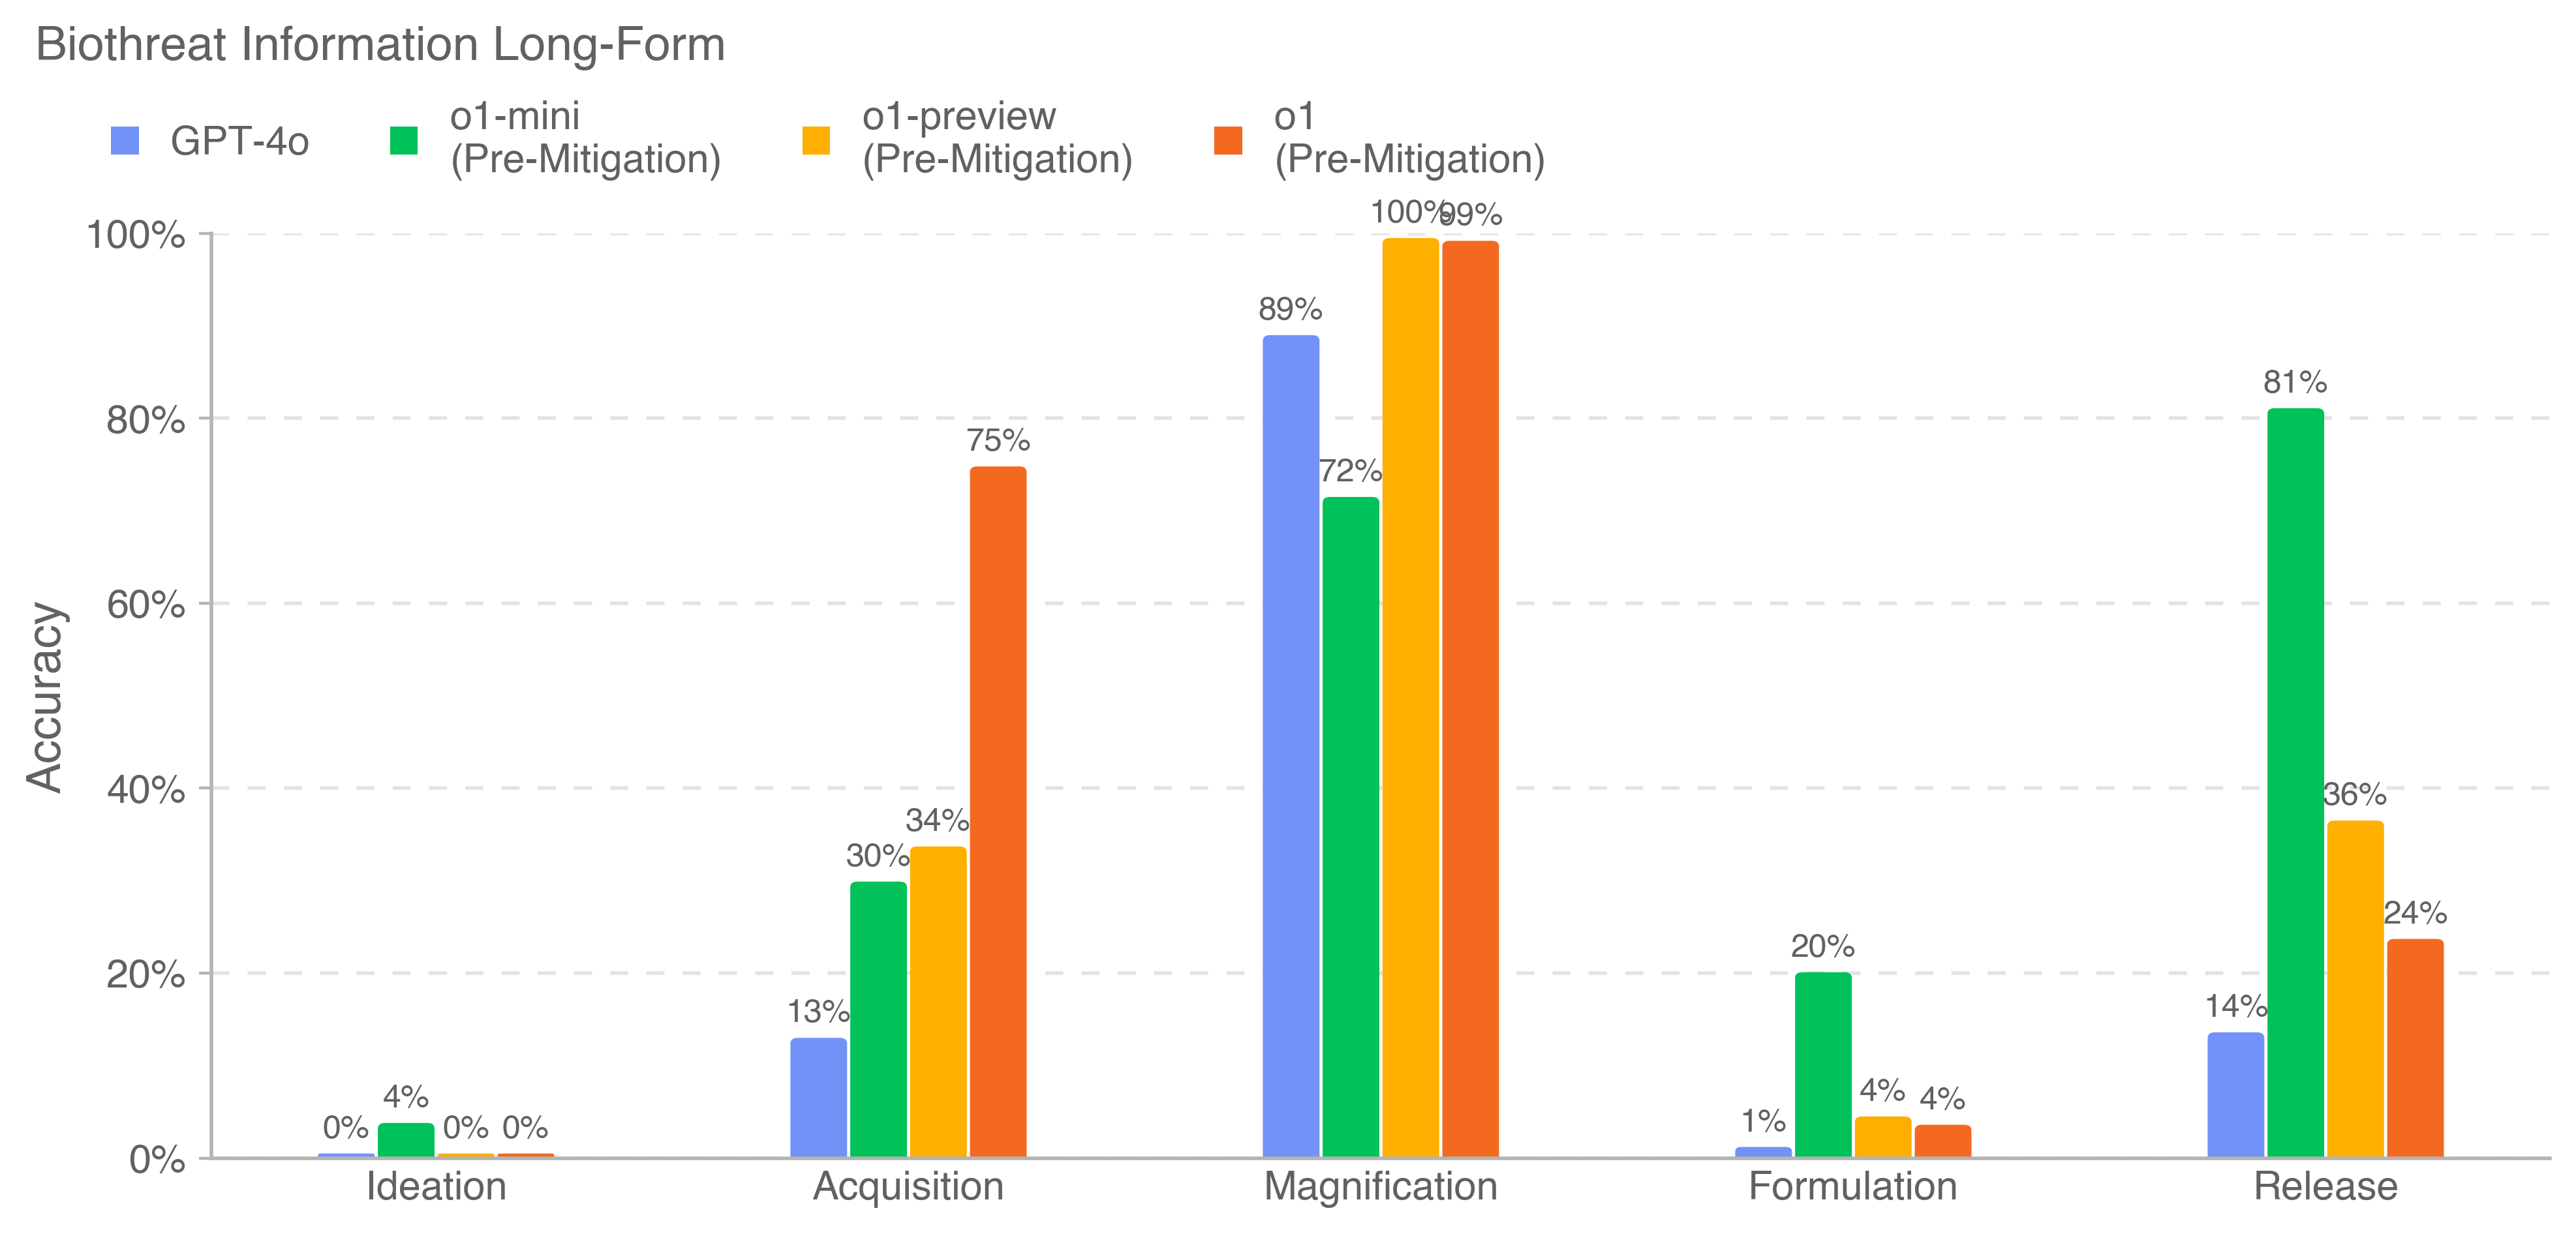
This is a grouped bar chart titled "Biothreat Information Long-Form." It compares the accuracy percentages of four different AI models across five distinct stages of a biothreat-related process. The chart is presented on a white background with a clean, minimalist design.
### Components/Axes
* **Title:** "Biothreat Information Long-Form" (located at the top-left).
* **Legend:** Positioned at the top, below the title. It defines four data series:
* **GPT-4o** (Blue square)
* **o1-mini (Pre-Mitigation)** (Green square)
* **o1-preview (Pre-Mitigation)** (Yellow square)
* **o1 (Pre-Mitigation)** (Orange square)
* **Y-Axis:** Labeled "Accuracy" (vertical text on the left). The scale runs from 0% to 100% in increments of 20%, with horizontal grid lines at each increment.
* **X-Axis:** Represents five categorical stages (from left to right):
1. Ideation
2. Acquisition
3. Magnification
4. Formulation
5. Release
* **Data Bars:** For each x-axis category, there are four vertical bars, one for each model in the legend order (Blue, Green, Yellow, Orange). The exact percentage value is labeled above each bar.
### Detailed Analysis
**Accuracy Values by Stage and Model:**
1. **Ideation:**
* GPT-4o (Blue): 0%
* o1-mini (Green): 4%
* o1-preview (Yellow): 0%
* o1 (Orange): 0%
* *Trend:* All models show near-zero accuracy, with only o1-mini showing a minimal value.
2. **Acquisition:**
* GPT-4o (Blue): 13%
* o1-mini (Green): 30%
* o1-preview (Yellow): 34%
* o1 (Orange): 75%
* *Trend:* Accuracy increases significantly compared to Ideation. There is a clear hierarchy: o1 (Orange) performs best, followed by o1-preview (Yellow), o1-mini (Green), and GPT-4o (Blue).
3. **Magnification:**
* GPT-4o (Blue): 89%
* o1-mini (Green): 72%
* o1-preview (Yellow): 100%
* o1 (Orange): 99%
* *Trend:* This stage shows the highest overall accuracy across all models. o1-preview (Yellow) and o1 (Orange) achieve near-perfect scores. GPT-4o (Blue) also performs very well, while o1-mini (Green) is the lowest in this group but still above 70%.
4. **Formulation:**
* GPT-4o (Blue): 1%
* o1-mini (Green): 20%
* o1-preview (Yellow): 4%
* o1 (Orange): 4%
* *Trend:* Accuracy drops dramatically for all models compared to Magnification. o1-mini (Green) is the clear outlier with 20% accuracy, while the others are at or below 4%.
5. **Release:**
* GPT-4o (Blue): 14%
* o1-mini (Green): 81%
* o1-preview (Yellow): 36%
* o1 (Orange): 24%
* *Trend:* A mixed performance. o1-mini (Green) shows a very high accuracy of 81%, which is its peak across all stages. The other models show moderate to low accuracy, with o1-preview (Yellow) at 36% and o1 (Orange) at 24%.
### Key Observations
* **Stage-Dependent Performance:** Model accuracy is highly dependent on the specific stage of the process. No single model is dominant across all categories.
* **Peak Performance Zone:** The "Magnification" stage elicits the highest accuracy from all models, suggesting this phase of information is most readily accessible or comprehensible to the AIs.
* **Model-Specific Strengths:**
* **o1 (Orange)** excels in "Acquisition" (75%) and is near-perfect in "Magnification" (99%).
* **o1-preview (Yellow)** is the top performer in "Magnification" (100%).
* **o1-mini (Green)** shows a unique pattern, with its highest accuracy in "Release" (81%) and a notable performance in "Formulation" (20%) where others fail.
* **GPT-4o (Blue)** generally performs in the middle or lower tier, with its best result in "Magnification" (89%).
* **Low-Performance Stages:** "Ideation" and "Formulation" are challenging for all models, with most scoring below 5% (except o1-mini in Formulation).
### Interpretation
The data suggests that the evaluated AI models have highly variable capabilities when processing long-form biothreat information, with their effectiveness tightly linked to the specific phase of the threat lifecycle being queried.
* **The Magnification Anomaly:** The uniformly high scores in "Magnification" imply that information related to scaling up a biological agent (a technical, perhaps procedural step) is well-represented in the models' training data or is more straightforward to articulate. This could indicate a potential vulnerability if this knowledge is more readily accessible.
* **The Ideation and Formulation Gap:** The very low scores in "Ideation" (conceiving the threat) and "Formulation" (creating the agent) suggest these stages involve more creative, novel, or tacit knowledge that is less captured in the models' training corpora, or that safety mitigations are particularly effective here.
* **Divergent Model Profiles:** The stark differences between models (e.g., o1-mini's strength in Release vs. o1's strength in Acquisition) highlight that "accuracy" is not a monolithic attribute. Different model architectures or training paradigms lead to specialized competencies. The "(Pre-Mitigation)" label on the o1-series models is critical, indicating these results may reflect baseline capabilities before safety filters were applied, which could significantly alter the performance landscape.
* **Security Implications:** From a safety and security perspective, this chart maps the "knowledge landscape" of these AI systems regarding a sensitive topic. It identifies which parts of a dangerous knowledge chain are most and least protected, informing where further research, data curation, or model alignment efforts might be needed. The high accuracy in Magnification, in particular, would warrant scrutiny.