## Line Graphs: Probability Distributions Across Event Sizes and Scenarios
### Overview
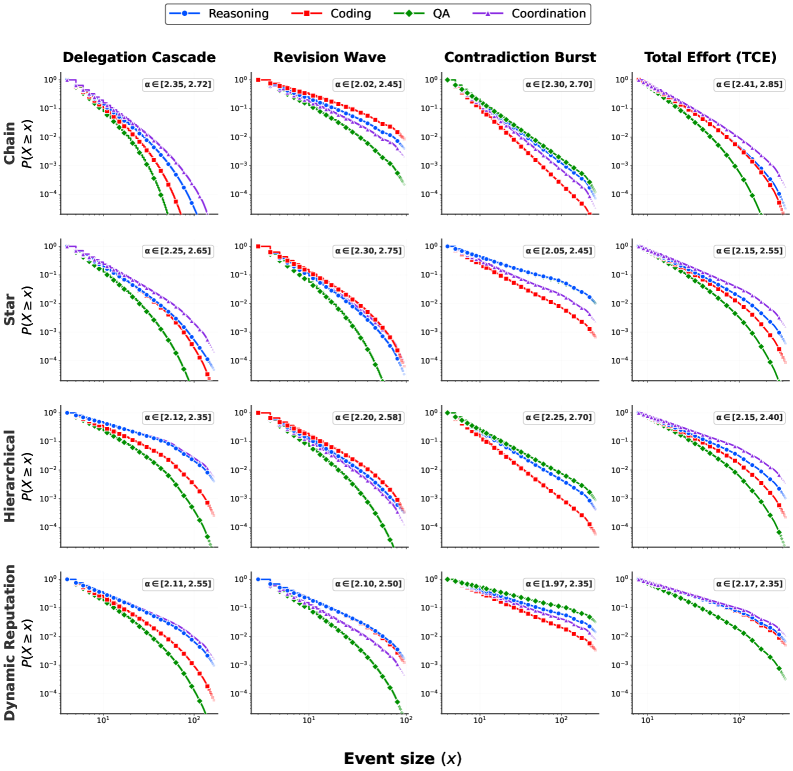
The image contains 16 line graphs arranged in a 4x4 grid, each representing probability distributions (P(X ≥ x)) across different event sizes (x) and scenarios. Graphs are labeled with scenario names (e.g., "Delegation Cascade," "Total Effort (TCE)"), and each includes four colored lines representing distinct categories: Reasoning (blue), Coding (red), QA (green), and Coordination (purple). All axes use logarithmic scales, and alpha (α) value ranges are provided for each graph.
---
### Components/Axes
- **X-axis**: Event size (x), logarithmic scale (10¹ to 10²).
- **Y-axis**: Probability (P(X ≥ x)), logarithmic scale (10⁻⁴ to 10⁰).
- **Legend**: Located at the top, mapping colors to categories:
- Blue: Reasoning
- Red: Coding
- Green: QA
- Purple: Coordination
- **Graph Titles**: Scenario names (e.g., "Delegation Cascade," "Revision Wave").
- **Alpha (α) Ranges**: Provided for each graph (e.g., α ∈ [2.35, 2.72] for "Delegation Cascade").
---
### Detailed Analysis
#### Delegation Cascade
- **Lines**: All four categories show decreasing trends.
- **Reasoning (blue)**: Starts near 10⁻¹ at x=10, drops to ~10⁻³ at x=100.
- **Coding (red)**: Similar trend, slightly lower than Reasoning.
- **QA (green)**: Slightly higher than Coding, ~10⁻² at x=10.
- **Coordination (purple)**: Highest initial value (~10⁻⁰ at x=10), steepest decline.
- **α**: [2.35, 2.72]
#### Revision Wave
- **Lines**: Similar decreasing trends.
- **Reasoning (blue)**: ~10⁻¹ at x=10, ~10⁻³ at x=100.
- **Coding (red)**: Slightly lower than Reasoning.
- **QA (green)**: ~10⁻² at x=10, ~10⁻⁴ at x=100.
- **Coordination (purple)**: Highest initial value (~10⁻⁰), gradual decline.
- **α**: [2.02, 2.45]
#### Contradiction Burst
- **Lines**:
- **Reasoning (blue)**: ~10⁻¹ at x=10, ~10⁻³ at x=100.
- **Coding (red)**: Slightly lower than Reasoning.
- **QA (green)**: ~10⁻² at x=10, ~10⁻⁴ at x=100.
- **Coordination (purple)**: Highest initial value (~10⁻⁰), steep decline.
- **α**: [2.30, 2.70]
#### Total Effort (TCE)
- **Lines**: Aggregated trends.
- **Reasoning (blue)**: ~10⁻¹ at x=10, ~10⁻³ at x=100.
- **Coding (red)**: Slightly lower than Reasoning.
- **QA (green)**: ~10⁻² at x=10, ~10⁻⁴ at x=100.
- **Coordination (purple)**: Highest initial value (~10⁻⁰), gradual decline.
- **α**: [2.41, 2.85]
#### Star
- **Lines**:
- **Reasoning (blue)**: ~10⁻¹ at x=10, ~10⁻³ at x=100.
- **Coding (red)**: Slightly lower than Reasoning.
- **QA (green)**: ~10⁻² at x=10, ~10⁻⁴ at x=100.
- **Coordination (purple)**: Highest initial value (~10⁻⁰), steep decline.
- **α**: [2.30, 2.65]
#### Hierarchical
- **Lines**:
- **Reasoning (blue)**: ~10⁻¹ at x=10, ~10⁻³ at x=100.
- **Coding (red)**: Slightly lower than Reasoning.
- **QA (green)**: ~10⁻² at x=10, ~10⁻⁴ at x=100.
- **Coordination (purple)**: Highest initial value (~10⁻⁰), gradual decline.
- **α**: [2.12, 2.35]
#### Dynamic Reputation
- **Lines**:
- **Reasoning (blue)**: ~10⁻¹ at x=10, ~10⁻³ at x=100.
- **Coding (red)**: Slightly lower than Reasoning.
- **QA (green)**: ~10⁻² at x=10, ~10⁻⁴ at x=100.
- **Coordination (purple)**: Highest initial value (~10⁻⁰), gradual decline.
- **α**: [2.10, 2.50]
---
### Key Observations
1. **Universal Decline**: All categories show decreasing probabilities as event size increases, consistent with logarithmic scaling.
2. **Coordination Dominance**: The purple line (Coordination) consistently starts at the highest probability (~10⁰) across most graphs, suggesting it dominates smaller event sizes.
3. **QA Variability**: QA (green) shows the steepest declines in some graphs (e.g., "Revision Wave"), indicating lower resilience at larger event sizes.
4. **Alpha Ranges**: α values vary by scenario, with "Total Effort (TCE)" having the highest upper bound (2.85), implying greater uncertainty or broader applicability.
---
### Interpretation
The data suggests that **Coordination** is the most robust category across scenarios, maintaining higher probabilities at smaller event sizes. **QA** and **Coding** exhibit similar trends but with lower initial probabilities, while **Reasoning** bridges the gap. The **Total Effort (TCE)** graph aggregates these categories, highlighting their combined impact. The varying α ranges indicate scenario-specific confidence intervals, with "Total Effort" reflecting the highest uncertainty. This could imply that larger events require more coordinated efforts, while smaller events are dominated by individual category contributions. The logarithmic scales emphasize exponential decay in probabilities, underscoring the importance of early-stage event management.