## Chart: Posterior Density for Toxicity Probability
### Overview
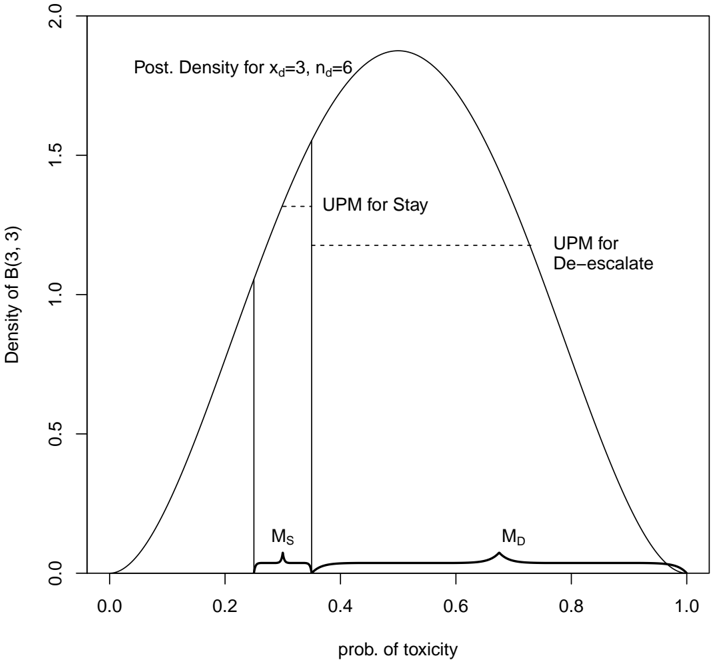
The image is a plot showing the posterior density of a Beta distribution B(3, 3) representing the probability of toxicity. The x-axis represents the probability of toxicity, ranging from 0.0 to 1.0. The y-axis represents the density of the Beta distribution, ranging from 0.0 to 2.0. The plot also indicates decision boundaries for "Stay" and "De-escalate" actions based on the Upper Probability Mass (UPM). The posterior density is calculated for x_d = 3 and n_d = 6, where x_d is the number of toxicities observed and n_d is the total number of patients.
### Components/Axes
* **Title:** "Post. Density for x=3, n=6"
* **X-axis:** "prob. of toxicity", ranging from 0.0 to 1.0 in increments of 0.2.
* **Y-axis:** "Density of B(3, 3)", ranging from 0.0 to 2.0 in increments of 0.5.
* **Curve:** A bell-shaped curve representing the posterior density.
* **UPM for Stay:** A horizontal dashed line indicating the Upper Probability Mass for the "Stay" action. The line starts at approximately x=0.28 and extends to x=0.4, with a y-value of approximately 1.35.
* **UPM for De-escalate:** A horizontal dashed line indicating the Upper Probability Mass for the "De-escalate" action. The line starts at approximately x=0.4 and extends to x=0.8, with a y-value of approximately 1.15.
* **Ms:** A bracket indicating the region for "Stay", spanning from approximately 0.2 to 0.4 on the x-axis.
* **Md:** A bracket indicating the region for "De-escalate", spanning from approximately 0.4 to 1.0 on the x-axis.
### Detailed Analysis
* **Posterior Density Curve:** The curve is unimodal and symmetric, peaking at approximately x=0.5 with a density of approximately 1.8.
* **UPM for Stay:** The dashed line for "UPM for Stay" is positioned at approximately y=1.35. A vertical line extends from the x-axis at approximately x=0.28 up to the curve and another vertical line extends from the x-axis at approximately x=0.4 up to the curve.
* **UPM for De-escalate:** The dashed line for "UPM for De-escalate" is positioned at approximately y=1.15.
* **Ms Region:** The "Ms" bracket spans from approximately x=0.2 to x=0.4.
* **Md Region:** The "Md" bracket spans from approximately x=0.4 to x=1.0.
### Key Observations
* The posterior density is centered around 0.5, indicating that the most probable value for the toxicity probability is 0.5.
* The "Stay" action is recommended if the probability of toxicity falls within the Ms region (approximately 0.2 to 0.4).
* The "De-escalate" action is recommended if the probability of toxicity falls within the Md region (approximately 0.4 to 1.0).
* The UPM for Stay is higher than the UPM for De-escalate.
### Interpretation
The plot illustrates a decision-making process based on the posterior distribution of the probability of toxicity. Given the observed data (x_d = 3 toxicities out of n_d = 6 patients), the posterior distribution B(3, 3) is used to determine whether to "Stay" at the current dose level or "De-escalate" to a lower dose. The UPM values for each action define the decision boundaries. If the probability of toxicity is relatively low (within the Ms region), the "Stay" action is preferred. If the probability of toxicity is higher (within the Md region), the "De-escalate" action is preferred. The specific UPM values (1.35 and 1.15) represent thresholds that balance the risks and benefits of each action. The symmetry of the Beta distribution suggests that the prior belief about the toxicity probability was relatively neutral.