## Heatmap: Matrix of Numerical Values
### Overview
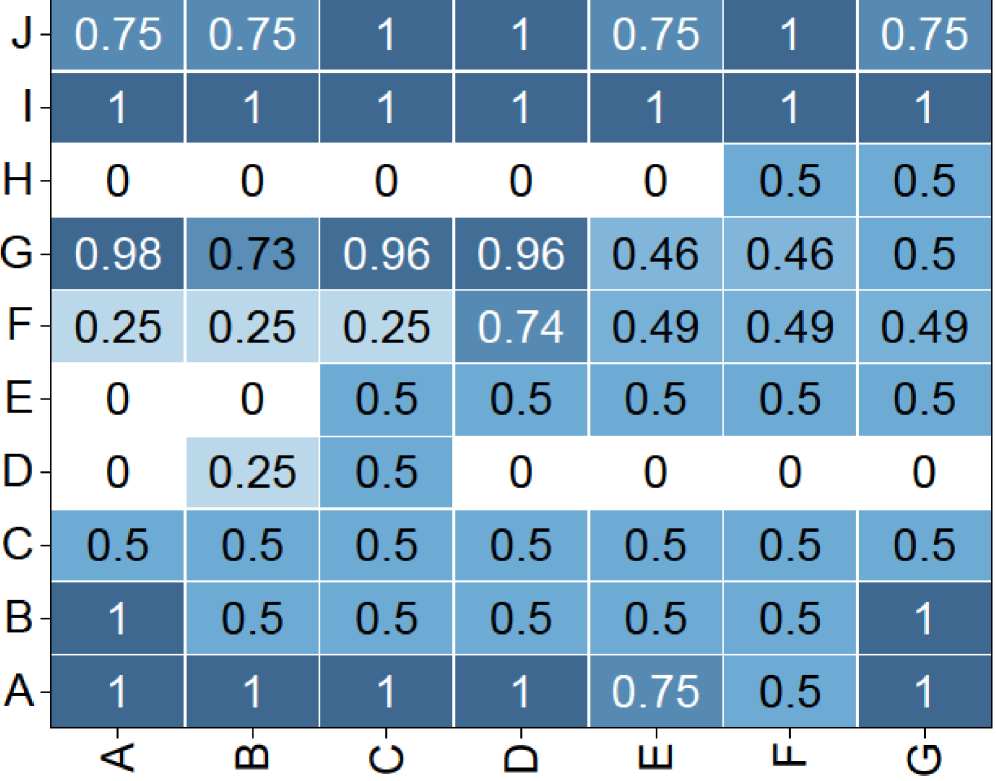
The image displays a 10x7 heatmap with rows labeled A-J and columns labeled A-G. Each cell contains a numerical value ranging from 0 to 1, with varying shades of blue representing magnitude. The heatmap lacks explicit axis titles or legends, but color intensity correlates with value magnitude (darker blue = higher value).
### Components/Axes
- **Rows**: Labeled A-J (vertical axis, left side)
- **Columns**: Labeled A-G (horizontal axis, top)
- **Values**: Numerical entries in each cell (0 to 1, with two decimal places for non-integer values)
- **Color Gradient**: Light blue (low values) to dark blue (high values)
### Detailed Analysis
#### Row-by-Row Values:
- **A**: [1, 1, 1, 1, 0.75, 0.5, 1]
- **B**: [1, 0.5, 0.5, 0.5, 0.5, 0.5, 1]
- **C**: [0.5, 0.5, 0.5, 0.5, 0.5, 0.5, 0.5]
- **D**: [0, 0.25, 0.5, 0, 0, 0, 0]
- **E**: [0, 0, 0.5, 0.5, 0.5, 0.5, 0.5]
- **F**: [0.25, 0.25, 0.25, 0.74, 0.49, 0.49, 0.49]
- **G**: [0.98, 0.73, 0.96, 0.96, 0.46, 0.46, 0.5]
- **H**: [0, 0, 0, 0, 0, 0.5, 0.5]
- **I**: [1, 1, 1, 1, 1, 1, 1]
- **J**: [0.75, 0.75, 1, 1, 0.75, 1, 0.75]
#### Column-by-Column Values:
- **A**: [1, 1, 0.5, 0, 0, 0.25, 0.98, 0, 1, 0.75]
- **B**: [1, 0.5, 0.5, 0.25, 0, 0.25, 0.73, 0, 1, 0.75]
- **C**: [1, 0.5, 0.5, 0.5, 0.5, 0.25, 0.96, 0, 1, 1]
- **D**: [1, 0.5, 0.5, 0, 0.5, 0.74, 0.96, 0, 1, 1]
- **E**: [0.75, 0.5, 0.5, 0.5, 0.5, 0.49, 0.46, 0.5, 1, 0.75]
- **F**: [1, 0.5, 0.5, 0, 0, 0.49, 0.46, 0.5, 1, 1]
- **G**: [1, 1, 0.5, 0, 0.5, 0.49, 0.5, 0.5, 1, 0.75]
### Key Observations
1. **Row I** contains all 1s, indicating maximum values across all columns.
2. **Rows H and D** have multiple zeros, suggesting no correlation or activity in those rows.
3. **Column G** has the highest concentration of 1s (rows A, B, I, J).
4. **Diagonal patterns**: Rows A, B, I, J show 1s in columns A and G, suggesting symmetry or identity relationships.
5. **Mid-range values (0.5)**: Dominant in rows C, E, and F, indicating moderate magnitudes.
6. **Anomalies**:
- Row F has a spike at column D (0.74) followed by lower values.
- Row G shows a drop from 0.96 (column C) to 0.46 (column E).
### Interpretation
This heatmap likely represents a **correlation matrix** or **similarity score** between categories A-J and A-G. Key insights:
- **Identity relationships**: Rows A, B, I, J and column G exhibit 1s, suggesting self-correlation or perfect alignment.
- **Weak/no correlation**: Rows H and D (with zeros) may represent categories with no interaction.
- **Moderate relationships**: Mid-values (0.5) in rows C, E, F indicate balanced but not extreme connections.
- **Outliers**: Row F’s 0.74 in column D and row G’s 0.98 in column A suggest localized high correlations.
The structure implies a systematic comparison, possibly in fields like machine learning (feature similarity), biology (gene expression), or social network analysis (node relationships). The absence of a legend limits precise interpretation of color scales, but the gradient aligns with standard heatmap conventions.