## Heatmap: Similarity Matrix
### Overview
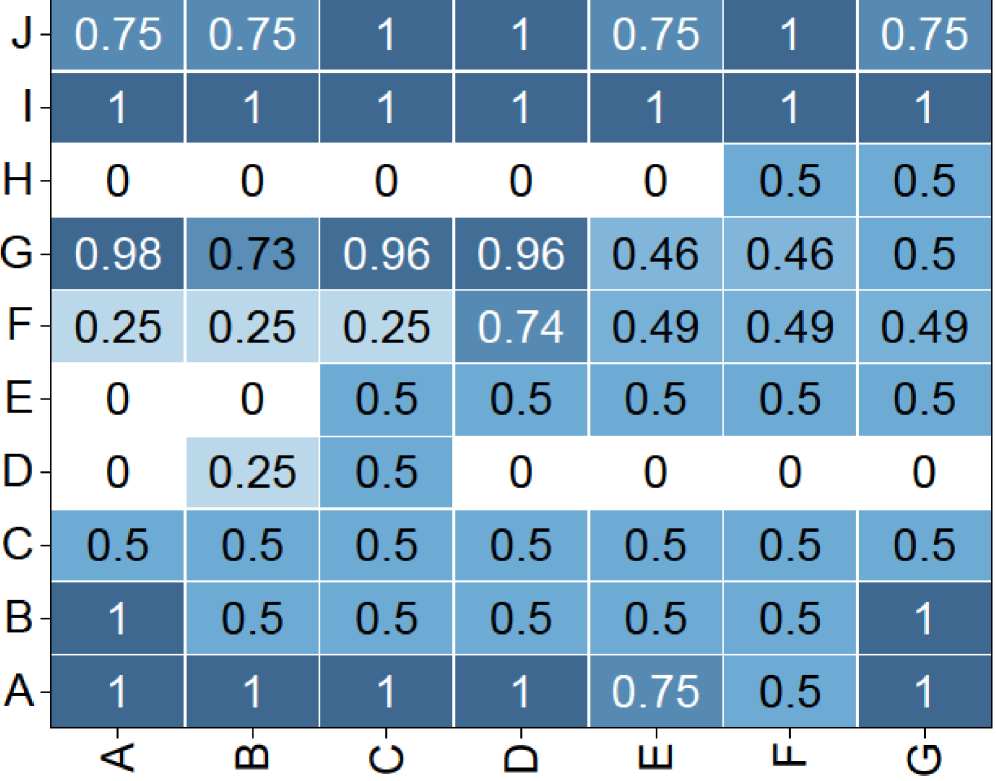
The image is a heatmap representing a similarity matrix. The rows and columns are labeled with letters A through J and A through G respectively. The cells are colored based on the numerical value they contain, ranging from 0 to 1, with darker shades of blue indicating higher values.
### Components/Axes
* **Rows:** Labeled A through J from bottom to top.
* **Columns:** Labeled A through G from left to right.
* **Values:** Numerical values within each cell, ranging from 0 to 1. The color intensity corresponds to the value, with darker blue representing higher values and lighter blue representing lower values.
### Detailed Analysis
Here's a breakdown of the values in the matrix:
* **Row A:**
* A: 1
* B: 1
* C: 1
* D: 1
* E: 0.75
* F: 0.5
* G: 1
* **Row B:**
* A: 1
* B: 0.5
* C: 0.5
* D: 0.5
* E: 0.5
* F: 0.5
* G: 1
* **Row C:**
* A: 0.5
* B: 0.5
* C: 0.5
* D: 0.5
* E: 0.5
* F: 0.5
* G: 0.5
* **Row D:**
* A: 0
* B: 0.25
* C: 0.5
* D: 0
* E: 0
* F: 0
* G: 0
* **Row E:**
* A: 0
* B: 0
* C: 0.5
* D: 0.5
* E: 0.5
* F: 0.5
* G: 0.5
* **Row F:**
* A: 0.25
* B: 0.25
* C: 0.25
* D: 0.74
* E: 0.49
* F: 0.49
* G: 0.49
* **Row G:**
* A: 0.98
* B: 0.73
* C: 0.96
* D: 0.96
* E: 0.46
* F: 0.46
* G: 0.5
* **Row H:**
* A: 0
* B: 0
* C: 0
* D: 0
* E: 0
* F: 0.5
* G: 0.5
* **Row I:**
* A: 1
* B: 1
* C: 1
* D: 1
* E: 1
* F: 1
* G: 1
* **Row J:**
* A: 0.75
* B: 0.75
* C: 1
* D: 1
* E: 0.75
* F: 1
* G: 0.75
### Key Observations
* Rows A, B, I have relatively high values across most columns.
* Rows D and H have relatively low values across most columns.
* Row C has a constant value of 0.5 across all columns.
### Interpretation
The heatmap visualizes the similarity between different entities represented by the rows and columns. Higher values (darker blue) indicate greater similarity. For example, entity 'I' is highly similar to entities 'A', 'B', 'C', 'D', 'E', 'F', and 'G'. Entity 'D' shows very little similarity to any of the entities 'A' through 'G'. The matrix is not symmetrical, meaning the similarity between A and B is not necessarily the same as the similarity between B and A (only A-G columns are present).