\n
## Pie Chart: Text Quality Distribution
### Overview
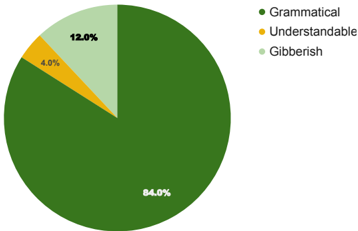
This image presents a pie chart illustrating the distribution of text quality categorized into three classes: Grammatical, Understandable, and Gibberish. The chart visually represents the percentage of text falling into each category.
### Components/Axes
The chart is a standard pie chart with no explicit axes. The categories are defined by color and labeled in a legend positioned to the right of the chart.
* **Categories:**
* Grammatical
* Understandable
* Gibberish
* **Legend:**
* Green: Grammatical
* Yellow: Understandable
* Light Green: Gibberish
### Detailed Analysis
The pie chart segments represent the following percentages:
* **Grammatical (Green):** The largest segment, occupying approximately 84.0% of the pie.
* **Understandable (Yellow):** A smaller segment, representing approximately 4.0% of the pie.
* **Gibberish (Light Green):** The smallest segment, representing approximately 12.0% of the pie.
The segments are arranged clockwise, starting with the largest (Grammatical) at the bottom and proceeding to Understandable and then Gibberish.
### Key Observations
The overwhelming majority (84.0%) of the text is classified as "Grammatical". A small portion (4.0%) is "Understandable", and a moderate portion (12.0%) is categorized as "Gibberish".
### Interpretation
The data suggests that the majority of the analyzed text is well-formed and grammatically correct. However, a non-negligible portion (12%) is unintelligible ("Gibberish"), and a small portion is only "Understandable" but not necessarily grammatically perfect. This could indicate a source of data with varying quality, potentially including machine-generated text, errors in transcription, or text from diverse sources with differing linguistic standards. The large proportion of "Grammatical" text suggests a relatively high overall quality of the source material.