## Pie Chart: Language Proficiency
### Overview
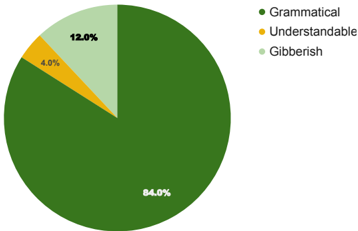
The pie chart illustrates the percentage of individuals who are proficient in three different languages: grammatical, understandable, and gibberish. The chart shows that the majority of individuals are proficient in grammatical language, followed by understandable language, and a small percentage in gibberish.
### Components/Axes
- **Labels**: Grammatical, Understandable, Gibberish
- **Scales**: Percentage
- **Legends**: Color-coded to match the labels
- **Axis Markers**: None
### Detailed Analysis or ### Content Details
- **Grammatical Language**: 84.0%
- **Understandable Language**: 12.0%
- **Gibberish Language**: 4.0%
### Key Observations
The chart indicates that the majority of individuals are proficient in grammatical language, suggesting that grammatical language is the most widely understood and used language among the three. The small percentage in gibberish language suggests that individuals who are not proficient in grammatical language may have difficulty understanding or communicating in this language.
### Interpretation
The data suggests that grammatical language is the most widely understood and used language among the three. This could be due to the fact that grammatical language is the most commonly taught and used language in most countries. The small percentage in gibberish language suggests that individuals who are not proficient in grammatical language may have difficulty understanding or communicating in this language. This could be due to a variety of factors, including language barriers, cultural differences, or lack of exposure to the language. Overall, the data suggests that grammatical language is the most widely understood and used language among the three, while gibberish language is the least understood and used language.