## Chart Type: Line Graphs
### Overview
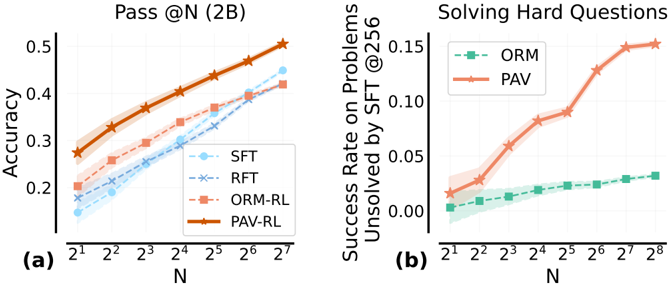
The image contains two line graphs comparing the performance of different models on two tasks: "Pass @N (2B)" and "Solving Hard Questions". The x-axis represents the number of samples (N) on a logarithmic scale (base 2), and the y-axis represents accuracy or success rate. The graphs compare the performance of models SFT, RFT, ORM-RL, and PAV-RL (in the first graph) and ORM and PAV (in the second graph).
### Components/Axes
**Graph (a): Pass @N (2B)**
* **Title:** Pass @N (2B)
* **X-axis:** N (Number of samples). Scale: 2<sup>1</sup>, 2<sup>2</sup>, 2<sup>3</sup>, 2<sup>4</sup>, 2<sup>5</sup>, 2<sup>6</sup>, 2<sup>7</sup>
* **Y-axis:** Accuracy. Scale: 0.2, 0.3, 0.4, 0.5
* **Legend (top-right):**
* SFT (light blue, dashed line with circle markers)
* RFT (light blue, dashed line with x markers)
* ORM-RL (light red, dashed line with square markers)
* PAV-RL (dark orange, solid line with star markers)
**Graph (b): Solving Hard Questions**
* **Title:** Solving Hard Questions
* **X-axis:** N (Number of samples). Scale: 2<sup>1</sup>, 2<sup>2</sup>, 2<sup>3</sup>, 2<sup>4</sup>, 2<sup>5</sup>, 2<sup>6</sup>, 2<sup>7</sup>, 2<sup>8</sup>
* **Y-axis:** Success Rate on Problems Unsolved by SFT @256. Scale: 0.00, 0.05, 0.10, 0.15
* **Legend (top-right):**
* ORM (light green, dashed line with square markers)
* PAV (light red, solid line with star markers)
### Detailed Analysis
**Graph (a): Pass @N (2B)**
* **SFT (light blue, dashed line with circle markers):** Starts at approximately 0.18 accuracy at N=2<sup>1</sup> and increases to approximately 0.42 at N=2<sup>7</sup>. The trend is generally upward.
* **RFT (light blue, dashed line with x markers):** Starts at approximately 0.17 accuracy at N=2<sup>1</sup> and increases to approximately 0.40 at N=2<sup>7</sup>. The trend is generally upward.
* **ORM-RL (light red, dashed line with square markers):** Starts at approximately 0.20 accuracy at N=2<sup>1</sup> and increases to approximately 0.39 at N=2<sup>7</sup>. The trend is generally upward.
* **PAV-RL (dark orange, solid line with star markers):** Starts at approximately 0.28 accuracy at N=2<sup>1</sup> and increases to approximately 0.50 at N=2<sup>7</sup>. The trend is generally upward.
**Graph (b): Solving Hard Questions**
* **ORM (light green, dashed line with square markers):** Starts at approximately 0.00 at N=2<sup>1</sup> and increases to approximately 0.025 at N=2<sup>8</sup>. The trend is slightly upward.
* **PAV (light red, solid line with star markers):** Starts at approximately 0.02 at N=2<sup>1</sup>, increases sharply to approximately 0.08 at N=2<sup>4</sup>, and then continues to increase to approximately 0.15 at N=2<sup>8</sup>. The trend is upward.
### Key Observations
* In Graph (a), PAV-RL consistently outperforms the other models (SFT, RFT, ORM-RL) in terms of accuracy.
* In Graph (b), PAV significantly outperforms ORM in terms of the success rate on problems unsolved by SFT.
* Both graphs show an increase in performance (accuracy or success rate) as the number of samples (N) increases.
* The shaded regions around the lines likely represent confidence intervals or standard deviations, indicating the uncertainty in the performance estimates.
### Interpretation
The data suggests that the PAV-RL model is more effective than SFT, RFT, and ORM-RL for the "Pass @N (2B)" task. Additionally, the PAV model is more successful at solving hard questions that SFT cannot solve, compared to the ORM model. The increasing performance with larger N values indicates that all models benefit from more data. The confidence intervals provide a measure of the reliability of these conclusions. The "Solving Hard Questions" graph indicates that PAV is significantly better at addressing problems that SFT struggles with.