## Line Graphs: Performance Comparison Across Methods
### Overview
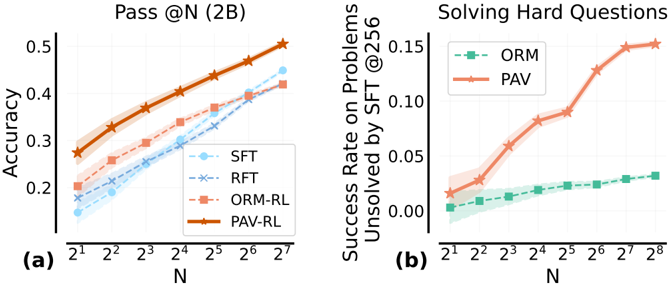
The image contains two line graphs comparing the performance of different methods (SFT, RFT, ORM-RL, PAV-RL) on two tasks: "Pass @N (2B)" and "Solving Hard Questions". Both graphs show performance metrics (accuracy and success rate) as a function of problem size (N), with N increasing exponentially from 2¹ to 2⁷ (graph a) and 2⁸ (graph b). Confidence intervals are represented by shaded regions around each line.
---
### Components/Axes
#### Graph (a): Pass @N (2B)
- **X-axis**: N (problem size), logarithmic scale from 2¹ to 2⁷.
- **Y-axis**: Accuracy (0.0 to 0.5).
- **Legend**:
- SFT: Dashed blue line with circle markers.
- RFT: Dotted blue line with cross markers.
- ORM-RL: Dashed orange line with square markers.
- PAV-RL: Solid orange line with star markers.
- **Shading**: Confidence intervals (light gray for SFT/RFT, light orange for ORM-RL/PAV-RL).
#### Graph (b): Solving Hard Questions
- **X-axis**: N (problem size), logarithmic scale from 2¹ to 2⁸.
- **Y-axis**: Success Rate on Problems Unsolved by SFT @256 (0.0 to 0.15).
- **Legend**:
- ORM: Dashed green line with square markers.
- PAV: Solid orange line with star markers.
- **Shading**: Confidence intervals (light green for ORM, light orange for PAV).
---
### Detailed Analysis
#### Graph (a): Pass @N (2B)
- **PAV-RL**:
- Starts at ~0.25 accuracy at N=2¹, rising steadily to ~0.5 at N=2⁷.
- Confidence interval widens slightly at larger N.
- **ORM-RL**:
- Begins at ~0.15, increases to ~0.4 at N=2⁷.
- Confidence interval remains narrow.
- **SFT**:
- Starts at ~0.1, reaches ~0.35 at N=2⁷.
- Confidence interval widens significantly at larger N.
- **RFT**:
- Starts at ~0.1, peaks at ~0.3 at N=2⁶, then plateaus.
- Confidence interval narrows at smaller N but widens at larger N.
#### Graph (b): Solving Hard Questions
- **PAV**:
- Starts at ~0.02 at N=2¹, rises sharply to ~0.15 at N=2⁸.
- Confidence interval widens at larger N.
- **ORM**:
- Starts at ~0.01, increases gradually to ~0.02 at N=2⁸.
- Confidence interval remains narrow.
---
### Key Observations
1. **PAV-RL/PAV** consistently outperforms other methods in both tasks, with the largest gap observed at larger N (e.g., N=2⁷ in graph a, N=2⁸ in graph b).
2. **ORM-RL** shows moderate improvement in graph (a) but minimal progress in graph (b), suggesting task-specific limitations.
3. **SFT/RFT** underperform PAV-RL in graph (a) but show comparable trends to ORM-RL in graph (b).
4. Confidence intervals widen for most methods as N increases, indicating greater uncertainty at larger problem sizes.
---
### Interpretation
The data demonstrates that **PAV-based methods** (PAV-RL and PAV) are significantly more effective than alternatives in both tasks, particularly as problem size grows. This suggests that PAV's approach (likely involving problem decomposition or hierarchical reasoning) scales better with complexity.
- **Graph (a)**: PAV-RL's steady improvement implies robustness in handling increasing problem sizes, while SFT/RFT's plateauing performance highlights limitations in generalization.
- **Graph (b)**: PAV's sharp rise indicates superior ability to solve harder questions, whereas ORM's stagnation suggests it struggles with tasks requiring advanced reasoning beyond its training.
The widening confidence intervals at larger N across most methods imply that performance becomes less predictable as problem complexity increases, emphasizing the need for further research into scalable reasoning frameworks.