# Technical Document Extraction: Heatmap Analysis of JS Divergence
## 1. Component Isolation
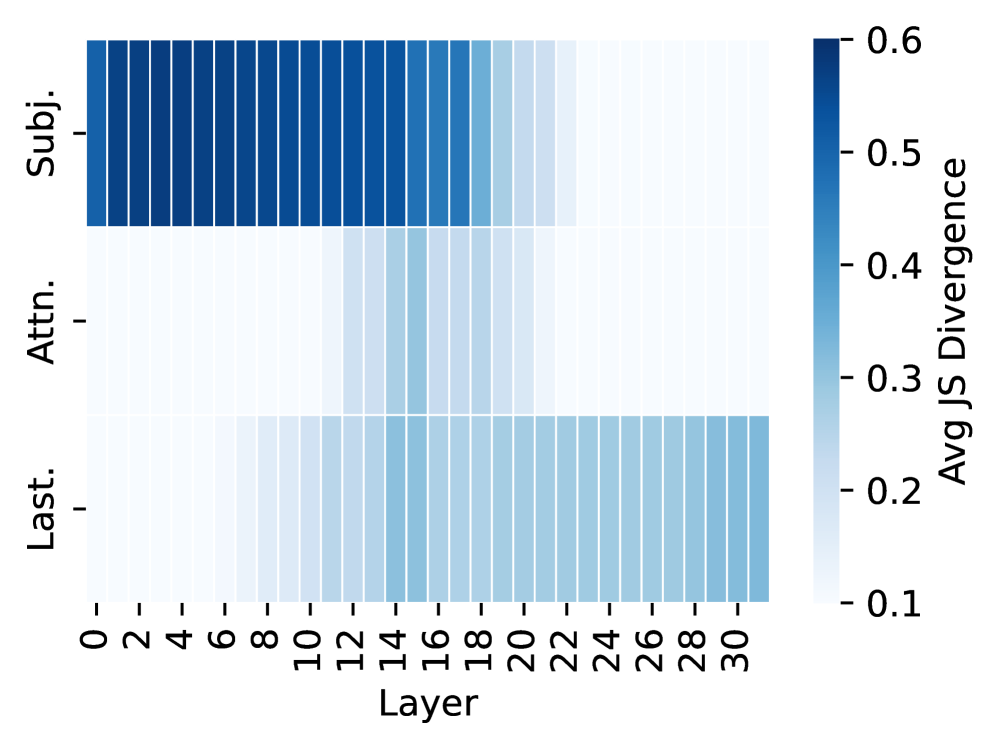
The image is a heatmap visualization representing data across different layers of a neural network model.
* **Header/Title:** None present.
* **Main Chart Area:** A grid of 3 rows and 32 columns (representing layers 0 through 31).
* **Y-Axis (Left):** Categorical labels representing different components or states.
* **X-Axis (Bottom):** Numerical labels representing model layers.
* **Legend (Right):** A vertical color scale bar indicating the magnitude of the measured metric.
---
## 2. Metadata and Labels
* **X-Axis Title:** `Layer`
* **X-Axis Markers:** 0, 2, 4, 6, 8, 10, 12, 14, 16, 18, 20, 22, 24, 26, 28, 30 (Total of 32 columns visible).
* **Y-Axis Labels:**
* `Subj.` (Top row)
* `Attn.` (Middle row)
* `Last.` (Bottom row)
* **Legend Title:** `Avg JS Divergence` (Jensen-Shannon Divergence)
* **Legend Scale:** 0.1 (Lightest blue/white) to 0.6 (Darkest blue).
---
## 3. Legend and Color Mapping
The legend is located at the far right of the image.
* **Dark Blue (~0.6):** High Average JS Divergence.
* **Medium Blue (~0.3 - 0.4):** Moderate Average JS Divergence.
* **Light Blue/White (~0.1):** Low Average JS Divergence.
---
## 4. Trend Verification and Data Extraction
### Row 1: Subj. (Subject)
* **Visual Trend:** Starts with very high intensity (dark blue) from Layer 0, maintains this intensity through the mid-layers, and then sharply fades to near-white in the final third of the layers.
* **Data Points:**
* **Layers 0 - 17:** High divergence (approx. 0.5 to 0.6).
* **Layers 18 - 22:** Transition period; divergence drops from approx. 0.4 to 0.2.
* **Layers 23 - 31:** Low divergence (approx. 0.1).
### Row 2: Attn. (Attention)
* **Visual Trend:** Predominantly low intensity (near-white) across almost the entire spectrum, with a very slight, subtle increase in the middle layers.
* **Data Points:**
* **Layers 0 - 11:** Very low divergence (~0.1).
* **Layers 12 - 16:** Slight increase to a very light blue (~0.15 - 0.2).
* **Layers 17 - 31:** Returns to very low divergence (~0.1).
### Row 3: Last. (Last Token/State)
* **Visual Trend:** Starts at very low intensity and gradually increases in saturation as the layer number increases, peaking and stabilizing in the latter half of the model.
* **Data Points:**
* **Layers 0 - 7:** Very low divergence (~0.1).
* **Layers 8 - 15:** Gradual upward slope in divergence (approx. 0.15 to 0.25).
* **Layers 16 - 31:** Sustained moderate divergence (approx. 0.3 to 0.35).
---
## 5. Summary of Findings
The heatmap illustrates a clear shift in information processing (measured by JS Divergence) across the 32 layers of the model:
1. **Subject information (`Subj.`)** is most prominent and divergent in the early to middle stages (Layers 0-18).
2. **Attention mechanisms (`Attn.`)** show minimal divergence across all layers, with a negligible peak around Layer 14.
3. **The final state/token (`Last.`)** gains divergence progressively, becoming the dominant feature in the latter half of the model (Layers 16-31), coinciding with the drop-off of the Subject information.