\n
## Heatmap: Jensen-Shannon Divergence by Layer and Subject
### Overview
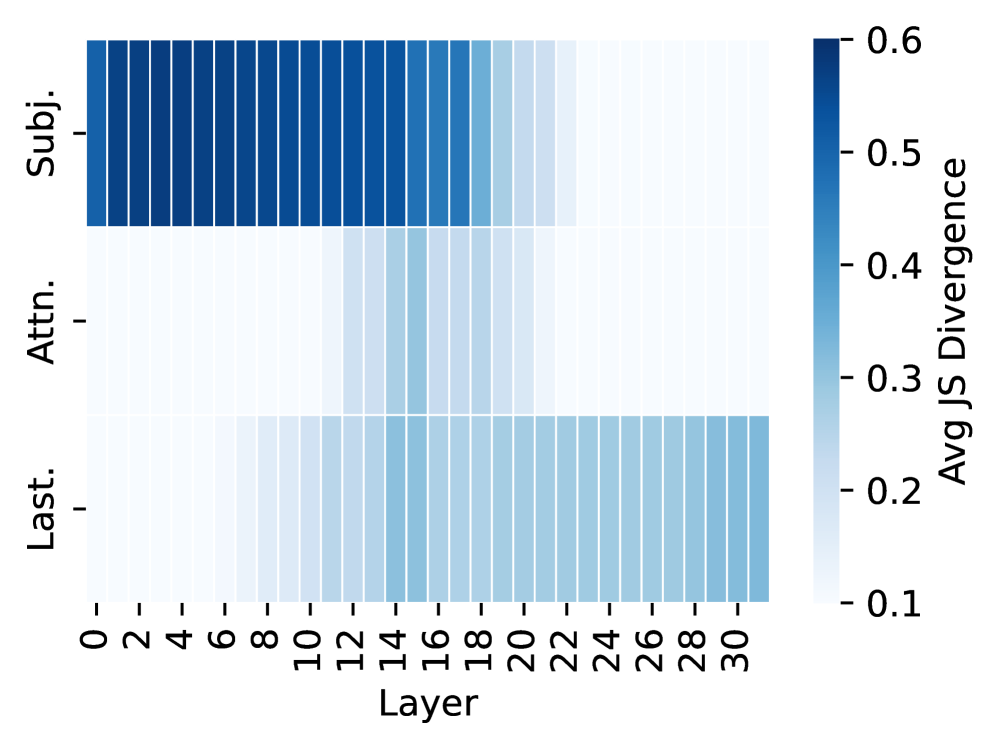
This image presents a heatmap visualizing the average Jensen-Shannon (JS) Divergence across different layers of a model, categorized by subject (Subj.), attention (Attn.), and last layer (Last.). The heatmap displays the divergence values using a color gradient, ranging from dark blue (high divergence) to light blue (low divergence).
### Components/Axes
* **X-axis:** Layer, ranging from 0 to 30, with increments of 2.
* **Y-axis:** Three categories: "Subj." (Subject), "Attn." (Attention), and "Last." (Last Layer).
* **Color Scale:** Represents "Avg JS Divergence", ranging from 0.1 to 0.6. The color scale is positioned on the right side of the heatmap.
* **Legend:** Located in the top-right corner, indicating the mapping between color and JS Divergence values.
### Detailed Analysis
The heatmap consists of three horizontal rows, each representing one of the categories (Subj., Attn., Last.). Each cell in the heatmap represents the average JS Divergence for a specific layer and category.
**Subject (Subj.):**
* The JS Divergence is initially high (approximately 0.55-0.6) for layers 0-6.
* There is a noticeable decrease in JS Divergence between layers 6 and 8 (down to approximately 0.45).
* From layers 8-14, the JS Divergence remains relatively stable around 0.45-0.5.
* A further decrease is observed from layers 14-20 (down to approximately 0.3).
* From layers 20-30, the JS Divergence continues to decrease, reaching approximately 0.2-0.3.
**Attention (Attn.):**
* The JS Divergence starts at a low value (approximately 0.15-0.2) for layers 0-4.
* It gradually increases from layers 4-10 (reaching approximately 0.35-0.4).
* From layers 10-20, the JS Divergence remains relatively stable around 0.4.
* A slight decrease is observed from layers 20-30 (down to approximately 0.3).
**Last Layer (Last.):**
* The JS Divergence starts at a very low value (approximately 0.1) for layers 0-6.
* It gradually increases from layers 6-14 (reaching approximately 0.25-0.3).
* From layers 14-30, the JS Divergence remains relatively stable around 0.25-0.3.
### Key Observations
* The "Subj." category exhibits the highest JS Divergence values, particularly in the initial layers.
* The "Last." category consistently shows the lowest JS Divergence values across all layers.
* The "Attn." category shows a moderate increase in JS Divergence in the middle layers, then plateaus.
* There is a clear trend of decreasing JS Divergence with increasing layer number for the "Subj." category.
### Interpretation
The heatmap suggests that the "Subject" component of the model initially has the most significant divergence from its expected distribution, but this divergence decreases as the model processes information through deeper layers. This could indicate that the initial layers are more sensitive to variations in the input subject, while later layers learn to generalize and reduce this sensitivity.
The "Last" layer consistently exhibits low divergence, suggesting that the final output of the model is relatively stable and predictable. The "Attention" layer shows a moderate divergence that remains relatively constant after the initial layers, indicating a consistent level of attention-related variation.
The decreasing trend in JS Divergence for the "Subj." category could be interpreted as the model learning to extract more abstract and invariant features as it progresses through the layers. The differences in divergence patterns between the three categories highlight the distinct roles and behaviors of each component within the model. The heatmap provides insights into the internal dynamics of the model and how different components contribute to its overall performance.