\n
## Bar Chart: BitOps Time vs Core Count
### Overview
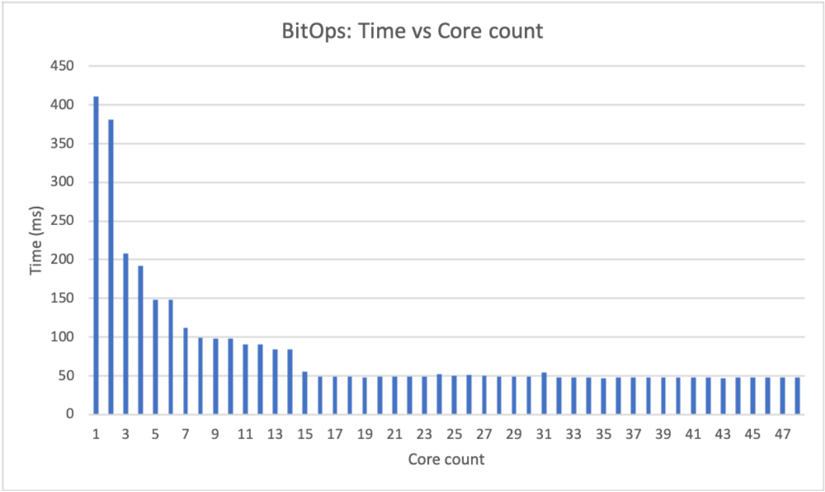
The image presents a bar chart illustrating the relationship between "Core count" and "Time (ms)" for a process labeled "BitOps". The chart displays the execution time of BitOps as the number of cores used increases.
### Components/Axes
* **Title:** "BitOps: Time vs Core count" - positioned at the top-center of the chart.
* **X-axis:** "Core count" - ranging from 1 to 47, with increments of 2.
* **Y-axis:** "Time (ms)" - ranging from 0 to 450, with increments of 50.
* **Data Series:** A single series of blue bars representing the time taken for BitOps at each core count.
### Detailed Analysis
The chart shows a steep decline in execution time as the core count increases initially, followed by a leveling off.
* **Core Count 1:** Time ≈ 400 ms
* **Core Count 3:** Time ≈ 190 ms
* **Core Count 5:** Time ≈ 120 ms
* **Core Count 7:** Time ≈ 100 ms
* **Core Count 9:** Time ≈ 90 ms
* **Core Count 11:** Time ≈ 80 ms
* **Core Count 13:** Time ≈ 70 ms
* **Core Count 15:** Time ≈ 60 ms
* **Core Count 17:** Time ≈ 55 ms
* **Core Count 19:** Time ≈ 50 ms
* **Core Count 21:** Time ≈ 45 ms
* **Core Count 23:** Time ≈ 40 ms
* **Core Count 25:** Time ≈ 40 ms
* **Core Count 27:** Time ≈ 40 ms
* **Core Count 29:** Time ≈ 40 ms
* **Core Count 31:** Time ≈ 40 ms
* **Core Count 33:** Time ≈ 40 ms
* **Core Count 35:** Time ≈ 40 ms
* **Core Count 37:** Time ≈ 40 ms
* **Core Count 39:** Time ≈ 40 ms
* **Core Count 41:** Time ≈ 40 ms
* **Core Count 43:** Time ≈ 40 ms
* **Core Count 45:** Time ≈ 40 ms
* **Core Count 47:** Time ≈ 40 ms
The trend is a rapid decrease in time from 1 to 7 cores, then a gradual decrease to around 17 cores, after which the time remains relatively constant at approximately 40 ms.
### Key Observations
* The most significant performance gains are achieved with a small number of cores (1-7).
* Adding more than 17 cores yields diminishing returns in terms of execution time reduction.
* The execution time plateaus at approximately 40 ms after 17 cores.
### Interpretation
The data suggests that the BitOps process is highly parallelizable, benefiting significantly from increased core counts up to a certain point. Beyond that point, the overhead of managing additional cores outweighs the performance gains. This could be due to factors such as memory bandwidth limitations, synchronization costs, or the inherent sequential nature of some parts of the BitOps algorithm. The leveling off of the curve indicates that the process has reached a point of diminishing returns, where adding more cores does not substantially reduce execution time. This information is valuable for optimizing the BitOps process by determining the optimal number of cores to utilize for maximum performance. The initial steep drop suggests that the process was initially bottlenecked by a lack of parallelism, and that increasing the core count effectively unlocked that potential.