\n
## Bar Chart: BitOps: Time vs Core count
### Overview
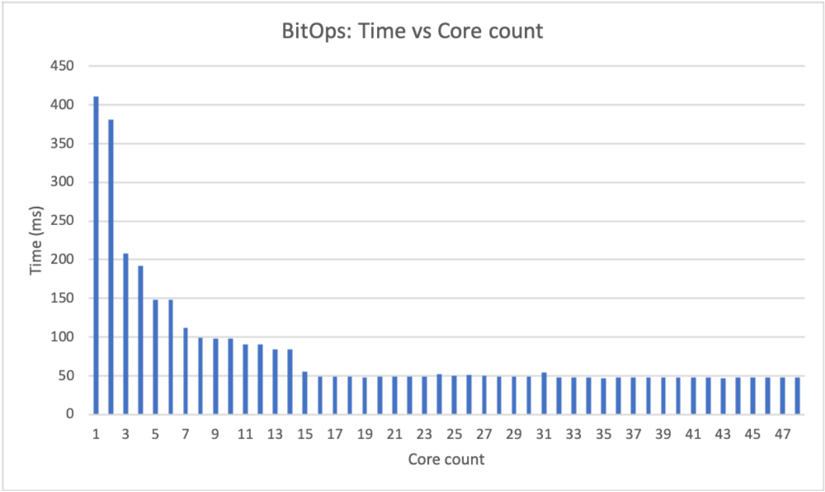
The image displays a vertical bar chart titled "BitOps: Time vs Core count". It illustrates the relationship between the number of processing cores used (x-axis) and the time taken for a "BitOps" operation in milliseconds (y-axis). The chart shows a clear trend of decreasing time as core count increases, which eventually plateaus.
### Components/Axes
* **Chart Title:** "BitOps: Time vs Core count" (centered at the top).
* **Y-Axis:**
* **Label:** "Time (ms)" (rotated vertically on the left side).
* **Scale:** Linear scale from 0 to 450, with major gridlines at intervals of 50 ms (0, 50, 100, 150, 200, 250, 300, 350, 400, 450).
* **X-Axis:**
* **Label:** "Core count" (centered at the bottom).
* **Scale:** Discrete, linear scale representing core counts from 1 to 47. Major tick marks and labels are provided for every odd number (1, 3, 5, ..., 47).
* **Data Series:** A single series represented by solid blue vertical bars. There is no legend, as only one data category is plotted.
* **Plot Area:** White background with light gray horizontal gridlines corresponding to the y-axis major ticks.
### Detailed Analysis
The chart plots the time (ms) for each core count from 1 to 47. The following table reconstructs the approximate data points, read from the chart. Values are estimates based on bar height relative to the y-axis gridlines.
| Core Count | Approx. Time (ms) | Core Count | Approx. Time (ms) | Core Count | Approx. Time (ms) |
| :--- | :--- | :--- | :--- | :--- | :--- |
| 1 | 410 | 17 | 50 | 33 | 50 |
| 2 | 380 | 18 | 50 | 34 | 50 |
| 3 | 205 | 19 | 50 | 35 | 50 |
| 4 | 190 | 20 | 50 | 36 | 50 |
| 5 | 150 | 21 | 50 | 37 | 50 |
| 6 | 145 | 22 | 50 | 38 | 50 |
| 7 | 110 | 23 | 50 | 39 | 50 |
| 8 | 100 | 24 | 50 | 40 | 50 |
| 9 | 100 | 25 | 50 | 41 | 50 |
| 10 | 95 | 26 | 50 | 42 | 50 |
| 11 | 90 | 27 | 50 | 43 | 50 |
| 12 | 85 | 28 | 50 | 44 | 50 |
| 13 | 85 | 29 | 50 | 45 | 50 |
| 14 | 55 | 30 | 50 | 46 | 50 |
| 15 | 50 | 31 | 55 | 47 | 50 |
| 16 | 50 | 32 | 50 | | |
**Trend Verification:** The data series exhibits a steep, non-linear downward trend. The time drops rapidly from core count 1 to approximately core count 15. From core count 15 onward, the time stabilizes, forming a long plateau with minimal variation around 50 ms, with a single minor outlier at core count 31 (~55 ms).
### Key Observations
1. **Diminishing Returns:** The most significant performance gains (reduction in time) occur when increasing cores from 1 to about 15. Adding cores beyond this point yields negligible improvement.
2. **Performance Plateau:** The system reaches a performance floor of approximately 50 ms at around 15 cores. This suggests a fundamental limit, such as serial overhead, memory bandwidth saturation, or the non-parallelizable portion of the task (Amdahl's Law).
3. **Anomaly:** There is a single, slight increase in time at core count 31 (~55 ms) compared to its neighbors, which are all at ~50 ms. This could be due to measurement noise, a system scheduling artifact, or a specific hardware topology quirk at that core count.
4. **Initial Scaling:** The scaling from 1 to 2 cores is relatively poor (410 ms to 380 ms), suggesting initial overhead in parallelization. The scaling becomes much more effective between 2 and 15 cores.
### Interpretation
This chart demonstrates the classic performance scaling behavior of a parallel computing task. The "BitOps" operation benefits significantly from parallelization up to a point, after which adding more computational resources (cores) does not reduce execution time.
* **What the data suggests:** The task has a substantial parallelizable component, allowing time to drop by roughly 8x (from ~410 ms to ~50 ms) as cores increase from 1 to 15. However, the plateau indicates a serial bottleneck or resource contention that becomes dominant beyond 15 cores.
* **How elements relate:** The x-axis (Core count) is the independent variable being controlled. The y-axis (Time) is the dependent performance metric. The shape of the bar plot directly visualizes the efficiency of parallel scaling for this specific workload.
* **Notable implications:** For practical purposes, allocating more than 15-16 cores to this specific "BitOps" task would be inefficient, as it provides no performance benefit. The optimal resource allocation for cost/performance would be around 15 cores. The outlier at 31 cores warrants investigation if consistent, as it may indicate a suboptimal core configuration for certain NUMA or cache architectures. The chart provides empirical evidence for capacity planning and performance optimization of the system running this workload.