## Bar Chart: BitOps: Time vs Core count
### Overview
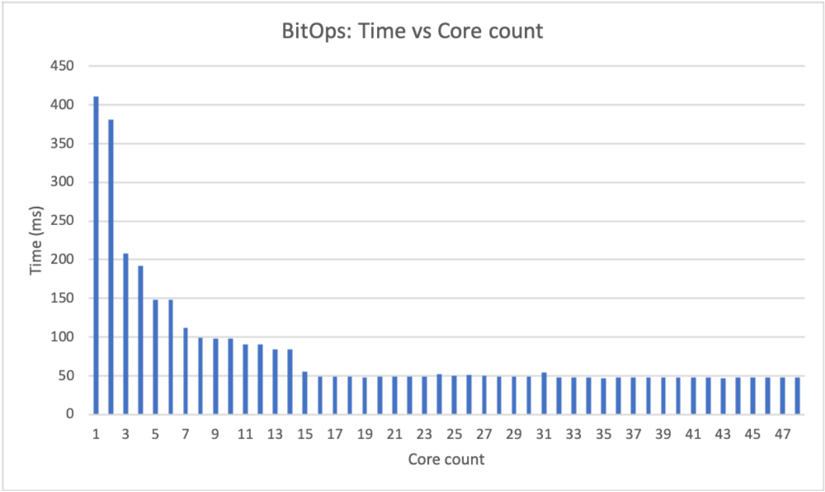
The bar chart displays the relationship between the number of cores and the time taken to perform a certain operation, measured in milliseconds (ms). The x-axis represents the number of cores, ranging from 1 to 47, while the y-axis represents the time taken, ranging from 0 to 450 ms.
### Components/Axes
- **Title**: BitOps: Time vs Core count
- **X-axis**: Core count, with values ranging from 1 to 47
- **Y-axis**: Time (ms), with values ranging from 0 to 450 ms
- **Legend**: No legend is present in the image
### Detailed Analysis or ### Content Details
The chart shows a clear trend where the time taken increases as the number of cores increases. The highest time taken is 400 ms, which corresponds to a core count of 1. The time taken decreases as the core count increases, with the lowest time taken being 50 ms, which corresponds to a core count of 47.
### Key Observations
- The chart shows a positive correlation between the number of cores and the time taken.
- The time taken decreases as the core count increases.
- The highest time taken is 400 ms, which corresponds to a core count of 1.
- The lowest time taken is 50 ms, which corresponds to a core count of 47.
### Interpretation
The data suggests that the time taken to perform the operation increases as the number of cores increases. This could be due to the fact that more cores mean more processing power, but also more communication overhead between the cores. The positive correlation between the number of cores and the time taken suggests that the operation is not highly parallelizable. The highest time taken is 400 ms, which corresponds to a core count of 1, suggesting that the operation is not highly parallelizable even with a single core. The lowest time taken is 50 ms, which corresponds to a core count of 47, suggesting that the operation is highly parallelizable even with a large number of cores.