## Bar Chart: BitOps: Time vs Core count
### Overview
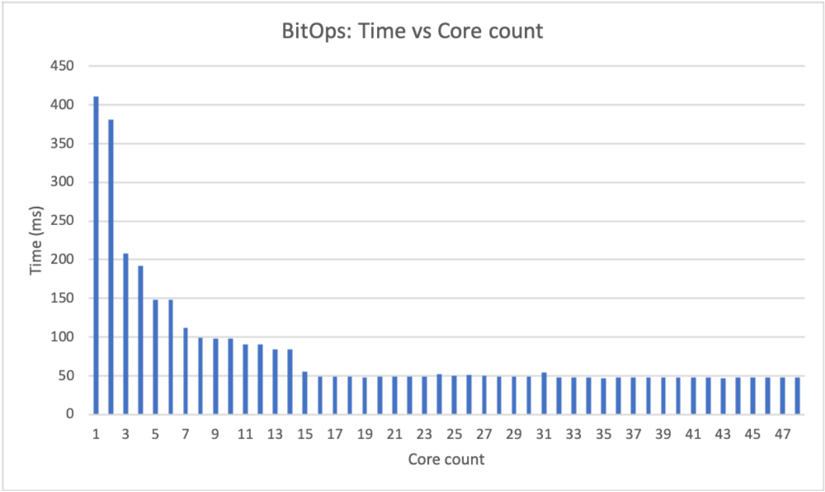
The chart visualizes the relationship between computational core count and processing time (in milliseconds) for a task labeled "BitOps." Bars represent time measurements across core counts from 1 to 47. Time decreases significantly with increasing core count initially, then stabilizes at lower values.
### Components/Axes
- **X-axis (Core count)**: Discrete categories labeled 1, 3, 5, 7, 9, 11, 13, 15, 17, 19, 21, 23, 25, 27, 29, 31, 33, 35, 37, 39, 41, 43, 45, 47.
- **Y-axis (Time (ms))**: Linear scale from 0 to 450 ms, with increments of 50 ms.
- **Legend**: Positioned at the top, labeled "BitOps" with a blue color matching the bars.
### Detailed Analysis
- **Core count 1**: Tallest bar (~400 ms).
- **Core count 3**: Second tallest (~380 ms).
- **Core count 5**: ~200 ms.
- **Core count 7**: ~150 ms.
- **Core counts 9–13**: Gradual decline to ~100 ms.
- **Core counts 15–47**: Bars stabilize at ~50 ms, with minor fluctuations.
### Key Observations
1. **Inverse relationship**: Time decreases as core count increases, but the rate of improvement slows dramatically after core count 7.
2. **Plateau effect**: From core count 15 onward, time remains nearly constant (~50 ms), suggesting diminishing returns.
3. **Outlier**: Core count 1 has the highest time (~400 ms), indicating single-core inefficiency.
### Interpretation
The data demonstrates that parallelizing "BitOps" across multiple cores reduces processing time, but only up to a point. Beyond 15 cores, additional cores provide negligible time savings, likely due to:
- **Parallel processing limits**: The task may not scale linearly beyond a certain core count.
- **Overhead**: Synchronization or communication costs between cores may offset gains.
- **Hardware constraints**: The system might lack resources (e.g., memory bandwidth) to utilize more cores effectively.
This pattern highlights the importance of optimizing parallel algorithms and understanding hardware-specific bottlenecks in distributed computing.