# Technical Document Extraction: Throughput Comparison Chart
## Chart Type
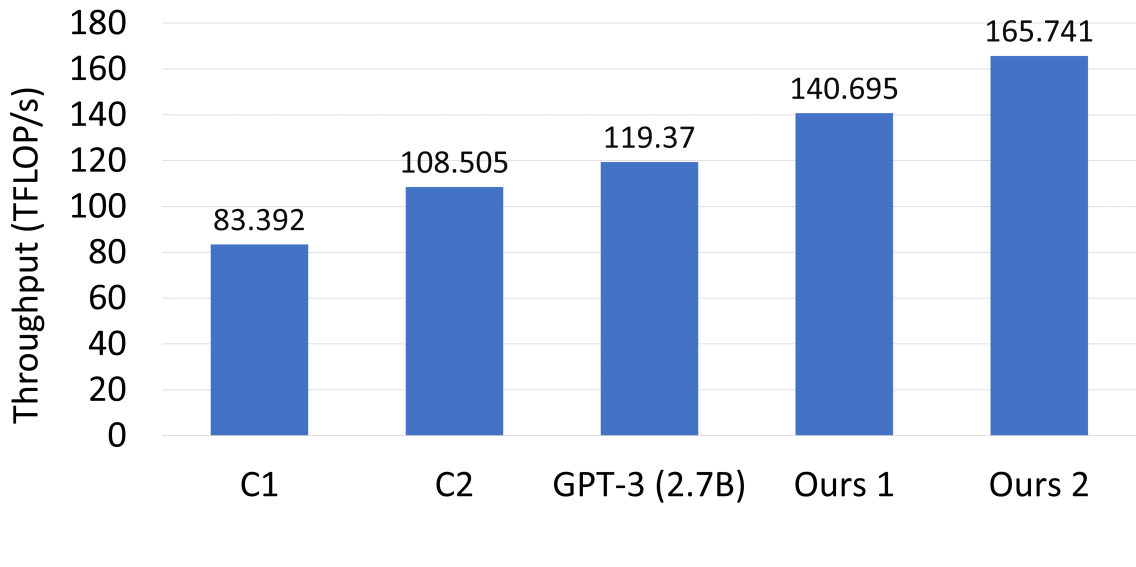
Bar chart comparing computational throughput (TFLOPs/s) across different models.
## Axis Labels
- **X-axis**: "Models" (categorical)
- Categories: C1, C2, GPT-3 (2.7B), Ours 1, Ours 2
- **Y-axis**: "Throughput (TFLOPs/s)" (numerical)
- Range: 0 to 180 (linear scale)
## Data Points
| Model | Throughput (TFLOPs/s) |
|----------------|-----------------------|
| C1 | 83.392 |
| C2 | 108.505 |
| GPT-3 (2.7B) | 119.37 |
| Ours 1 | 140.695 |
| Ours 2 | 165.741 |
## Visual Trends
- **Upward progression**: Throughput increases monotonically from left to right.
- **Key jumps**:
- C1 → C2: +25.113 TFLOPs/s
- C2 → GPT-3: +10.865 TFLOPs/s
- GPT-3 → Ours 1: +21.325 TFLOPs/s
- Ours 1 → Ours 2: +25.046 TFLOPs/s
## Color Coding
- All bars rendered in **blue** (no explicit legend visible; uniform color implies single data series).
## Spatial Grounding
- Bars positioned sequentially along X-axis from left (C1) to right (Ours 2).
- Numerical values displayed atop each bar for direct readability.
## Component Isolation
1. **Header**: No explicit title present.
2. **Main Chart**: Bar heights proportional to throughput values.
3. **Footer**: No source/attribution information visible.
## Trend Verification
- Confirmed: Each subsequent model shows higher throughput than the previous, with consistent incremental improvements.
## Data Table Reconstruction
| Model | Throughput (TFLOPs/s) |
|----------------|-----------------------|
| C1 | 83.392 |
| C2 | 108.505 |
| GPT-3 (2.7B) | 119.37 |
| Ours 1 | 140.695 |
| Ours 2 | 165.741 |
## Notes
- No non-English text detected.
- No explicit legend present; color consistency across bars suggests single data series.
- Values formatted to two decimal places for precision.