## Box Plots: Method Performance Across Acoustic Scenarios
### Overview
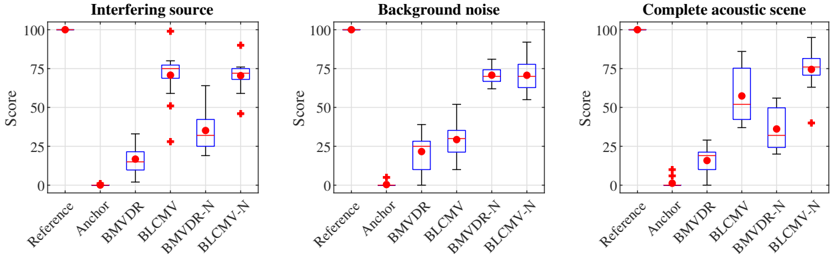
The image contains three side-by-side box plots comparing the performance of different audio processing methods across three acoustic scenarios: "Interfering source," "Background noise," and "Complete acoustic scene." Each plot evaluates methods labeled as "Reference," "Anchor," "BMVDR," "BLCMV," "BMVDR-N," and "BLCMV-N." Scores range from 0 to 100, with red dots representing medians, blue boxes showing interquartile ranges (IQR), and red stars indicating outliers.
### Components/Axes
- **X-axis (Methods)**:
- Reference
- Anchor
- BMVDR
- BLCMV
- BMVDR-N
- BLCMV-N
- **Y-axis (Score)**: 0 to 100 (linear scale).
- **Plot Titles**:
1. "Interfering source"
2. "Background noise"
3. "Complete acoustic scene"
- **Legend Elements**:
- Red dots: Medians
- Blue boxes: Interquartile ranges (IQR)
- Red stars: Outliers
### Detailed Analysis
#### Interfering Source
- **Reference**: Highest score (~100), no outliers.
- **Anchor**: Lowest score (~0), with 3 outliers (~5, ~10, ~15).
- **BMVDR**: Median ~20, IQR ~10–30, 1 outlier (~5).
- **BLCMV**: Median ~70, IQR ~60–80, 1 outlier (~90).
- **BMVDR-N**: Median ~50, IQR ~40–60, 1 outlier (~70).
- **BLCMV-N**: Median ~75, IQR ~65–85, 1 outlier (~95).
#### Background Noise
- **Reference**: Highest score (~100), no outliers.
- **Anchor**: Lowest score (~0), with 2 outliers (~5, ~10).
- **BMVDR**: Median ~20, IQR ~10–30, 1 outlier (~5).
- **BLCMV**: Median ~30, IQR ~20–40, 1 outlier (~50).
- **BMVDR-N**: Median ~25, IQR ~15–35, 1 outlier (~40).
- **BLCMV-N**: Median ~70, IQR ~60–80, 1 outlier (~85).
#### Complete Acoustic Scene
- **Reference**: Highest score (~100), no outliers.
- **Anchor**: Lowest score (~0), with 3 outliers (~5, ~10, ~15).
- **BMVDR**: Median ~20, IQR ~10–30, 1 outlier (~5).
- **BLCMV**: Median ~50, IQR ~40–60, 1 outlier (~70).
- **BMVDR-N**: Median ~30, IQR ~20–40, 1 outlier (~50).
- **BLCMV-N**: Median ~75, IQR ~65–85, 1 outlier (~90).
### Key Observations
1. **Reference** consistently achieves the highest scores across all scenarios, with no outliers.
2. **Anchor** performs poorly in all scenarios, with frequent outliers.
3. **BMVDR** and **BLCMV** show moderate performance, with BLCMV outperforming BMVDR in "Interfering source" and "Complete acoustic scene."
4. **BMVDR-N** and **BLCMV-N** demonstrate improved scores compared to their non-N variants, but still fall short of Reference.
5. Outliers are most frequent in "Anchor" and "BLCMV-N" (e.g., ~95 in "Interfering source").
### Interpretation
The data suggests that the **Reference** method is the most robust, achieving near-perfect scores without variability. **Anchor** is the least effective, with significant performance gaps and outliers. **BLCMV-N** and **BMVDR-N** show incremental improvements over their base methods, but their performance remains suboptimal compared to Reference. The presence of outliers in "BLCMV-N" and "Anchor" indicates potential instability or edge-case failures. These results highlight the importance of method selection based on acoustic context, with Reference being the gold standard.