\n
## Box Plot Charts: Performance Scores Under Different Acoustic Conditions
### Overview
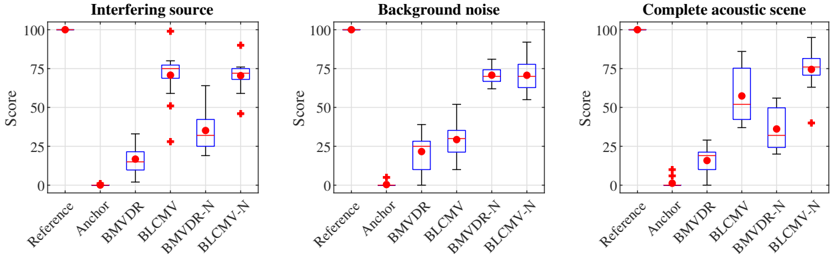
The image presents three box plot charts, each comparing the performance scores of different algorithms ("Reference", "Anchor", "BMVDR", "BLCMV", "BLCMV-N") under three distinct acoustic conditions: "Interfering source", "Background noise", and "Complete acoustic scene". Each chart displays the distribution of scores for each algorithm using box plots and individual data points.
### Components/Axes
Each chart shares the following components:
* **X-axis:** Algorithm names: "Reference", "Anchor", "BMVDR", "BLCMV", "BLCMV-N".
* **Y-axis:** "Score", ranging from 0 to 100, with tick marks at 0, 25, 50, 75, and 100.
* **Data Representation:** Box plots representing the interquartile range (IQR) and median of the scores for each algorithm. Individual red data points are plotted on top of the box plots, representing individual observations. Error bars extend from the box plots, indicating the range of the data.
* **Titles:** Each chart has a title indicating the acoustic condition: "Interfering source", "Background noise", and "Complete acoustic scene".
### Detailed Analysis or Content Details
**Chart 1: Interfering Source**
* **Reference:** The median score is approximately 5, with the box extending from roughly 0 to 15. Individual data points are scattered between 0 and 90.
* **Anchor:** The median score is approximately 70, with the box extending from roughly 50 to 85. Individual data points are scattered between 20 and 95.
* **BMVDR:** The median score is approximately 25, with the box extending from roughly 15 to 40. Individual data points are scattered between 10 and 60.
* **BLCMV:** The median score is approximately 65, with the box extending from roughly 50 to 80. Individual data points are scattered between 30 and 90.
* **BLCMV-N:** The median score is approximately 75, with the box extending from roughly 60 to 90. Individual data points are scattered between 40 and 95.
**Chart 2: Background Noise**
* **Reference:** The median score is approximately 5, with the box extending from roughly 0 to 15. Individual data points are scattered between 0 and 60.
* **Anchor:** The median score is approximately 75, with the box extending from roughly 60 to 90. Individual data points are scattered between 30 and 95.
* **BMVDR:** The median score is approximately 25, with the box extending from roughly 15 to 40. Individual data points are scattered between 10 and 60.
* **BLCMV:** The median score is approximately 70, with the box extending from roughly 55 to 85. Individual data points are scattered between 30 and 95.
* **BLCMV-N:** The median score is approximately 75, with the box extending from roughly 65 to 90. Individual data points are scattered between 40 and 95.
**Chart 3: Complete Acoustic Scene**
* **Reference:** The median score is approximately 5, with the box extending from roughly 0 to 15. Individual data points are scattered between 0 and 80.
* **Anchor:** The median score is approximately 75, with the box extending from roughly 60 to 90. Individual data points are scattered between 30 and 95.
* **BMVDR:** The median score is approximately 25, with the box extending from roughly 15 to 40. Individual data points are scattered between 10 and 60.
* **BLCMV:** The median score is approximately 55, with the box extending from roughly 40 to 70. Individual data points are scattered between 20 and 90.
* **BLCMV-N:** The median score is approximately 75, with the box extending from roughly 60 to 90. Individual data points are scattered between 40 and 95.
### Key Observations
* The "Reference" algorithm consistently performs the worst across all three acoustic conditions, with low median scores and a wide range of data points.
* The "Anchor" algorithm generally performs well, with high median scores and relatively tight distributions.
* "BLCMV-N" consistently shows high performance, often comparable to or slightly better than "Anchor".
* "BMVDR" shows moderate performance, consistently better than "Reference" but generally lower than "Anchor" and "BLCMV-N".
* The spread of data points (as indicated by the individual points and error bars) varies significantly between algorithms and acoustic conditions, suggesting varying levels of robustness.
### Interpretation
The data suggests that the "Anchor" and "BLCMV-N" algorithms are the most effective at maintaining performance across different acoustic environments. The "Reference" algorithm is consistently the least effective. The "BLCMV-N" algorithm appears to offer a slight improvement over the "Anchor" algorithm, particularly in the "Interfering source" and "Background noise" conditions.
The wide spread of data points for some algorithms indicates that their performance is sensitive to specific instances within each acoustic condition. This could be due to variations in the characteristics of the interfering source, background noise, or the overall acoustic scene.
The consistent poor performance of the "Reference" algorithm suggests it is not well-suited for these types of acoustic environments. The improvement offered by "BLCMV-N" over "BLCMV" suggests that the "N" component provides a beneficial enhancement, potentially related to noise reduction or interference cancellation. The charts provide a comparative analysis of algorithm performance, allowing for informed selection based on the expected acoustic conditions.