## Line Chart: Adapted Salary Density by Gender
### Overview
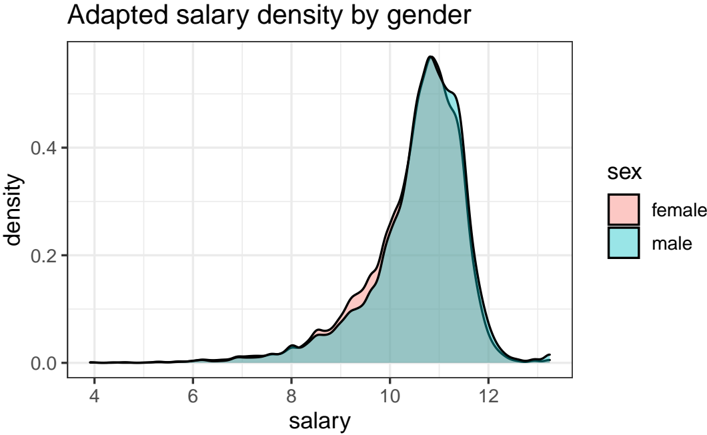
The chart visualizes the distribution of adapted salaries by gender, comparing the density of salaries for females (pink) and males (teal). Both distributions are plotted on a shared x-axis (salary) and y-axis (density), with overlapping curves indicating comparative trends.
### Components/Axes
- **X-axis (Salary)**: Ranges from 4 to 12, labeled "salary."
- **Y-axis (Density)**: Ranges from 0 to 0.4, labeled "density."
- **Legend**: Positioned on the right, with:
- Pink: Female
- Teal: Male
- **Curves**:
- Female (pink): Smoother, slightly left-shifted peak.
- Male (teal): Sharper, right-shifted peak with higher density.
### Detailed Analysis
- **Female Salary Density**:
- Peak density: ~0.35 at salary ~10.
- Distribution spans ~8 to ~12, with a gradual decline on both sides.
- Left tail extends slightly below 8, indicating lower-earning outliers.
- **Male Salary Density**:
- Peak density: ~0.45 at salary ~11.
- Distribution spans ~9 to ~13, with a steeper decline on the right.
- Left tail overlaps with female distribution near ~9.
- **Overlap**: Both curves intersect between ~9.5 and ~10.5, suggesting similar densities in this range.
### Key Observations
1. **Gender Pay Gap**: Male salaries peak higher (~11 vs. ~10 for females), indicating a systemic disparity.
2. **Distribution Variability**: Male salaries are more concentrated (narrower peak), while female salaries show broader variability.
3. **Outliers**: Female distribution includes lower-earning outliers (<8), absent in the male distribution.
### Interpretation
The data suggests a persistent gender pay gap, with males earning higher salaries on average. The narrower male distribution may reflect occupational segregation or systemic biases favoring male-dominated fields. The female distribution’s broader spread could indicate underrepresentation in high-paying roles or greater diversity in job types. The overlap between ~9.5–10.5 highlights a critical intersection where salary equity is more achievable, but systemic factors still drive disparities at higher earnings tiers.