\n
## Line Chart: Fitness Value vs. Generation
### Overview
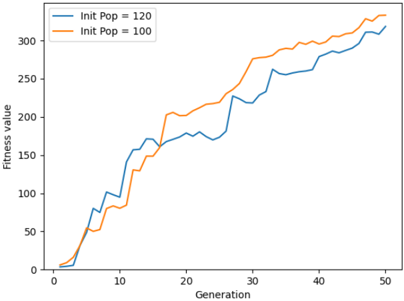
The image presents a line chart illustrating the relationship between 'Generation' and 'Fitness Value' for two different initial population sizes. The chart compares the evolution of fitness over generations for an initial population of 120 and an initial population of 100.
### Components/Axes
* **X-axis:** 'Generation', ranging from 0 to 50. The axis is labeled at intervals of 10.
* **Y-axis:** 'Fitness value', ranging from 0 to 320. The axis is labeled at intervals of 50.
* **Legend:** Located in the top-left corner.
* 'Init Pop = 120' - Represented by a blue line.
* 'Init Pop = 100' - Represented by an orange line.
### Detailed Analysis
**Line 1: Init Pop = 120 (Blue)**
The blue line representing 'Init Pop = 120' starts at approximately 0 at Generation 0. It exhibits a generally upward trend, with several plateaus and dips.
* At Generation 5, the fitness value is approximately 60.
* At Generation 10, the fitness value is approximately 110.
* At Generation 15, the fitness value is approximately 160.
* At Generation 20, the fitness value is approximately 190.
* At Generation 25, the fitness value is approximately 240.
* At Generation 30, the fitness value is approximately 260, followed by a dip to around 240.
* At Generation 35, the fitness value is approximately 270.
* At Generation 40, the fitness value is approximately 290.
* At Generation 45, the fitness value is approximately 310.
* At Generation 50, the fitness value is approximately 320.
**Line 2: Init Pop = 100 (Orange)**
The orange line representing 'Init Pop = 100' also starts at approximately 0 at Generation 0 and shows an overall upward trend. It appears to be smoother than the blue line, with fewer sharp dips.
* At Generation 5, the fitness value is approximately 50.
* At Generation 10, the fitness value is approximately 100.
* At Generation 15, the fitness value is approximately 150.
* At Generation 20, the fitness value is approximately 190.
* At Generation 25, the fitness value is approximately 250.
* At Generation 30, the fitness value is approximately 280.
* At Generation 35, the fitness value is approximately 300.
* At Generation 40, the fitness value is approximately 310.
* At Generation 45, the fitness value is approximately 320.
* At Generation 50, the fitness value is approximately 330.
### Key Observations
* Both initial population sizes demonstrate increasing fitness values over generations, indicating successful evolution.
* The 'Init Pop = 100' line generally exhibits a higher fitness value than the 'Init Pop = 120' line, particularly after Generation 30.
* The 'Init Pop = 120' line shows more volatility in fitness, with more pronounced dips and plateaus, suggesting a potentially more complex evolutionary path.
### Interpretation
The chart suggests that a smaller initial population size (100) may lead to faster or more consistent fitness improvement compared to a larger initial population size (120) in this specific evolutionary process. The greater volatility observed in the 'Init Pop = 120' line could indicate a higher degree of exploration in the search space, potentially leading to both higher peaks and deeper valleys in fitness. The data implies that the initial population size influences the evolutionary trajectory and the rate of adaptation. The difference in final fitness values suggests that the initial population size is a significant parameter in the optimization process. The chart demonstrates a typical evolutionary trend where fitness increases over generations, but the specific path and final outcome are sensitive to initial conditions.