## Line Chart: Fitness Value vs. Generation for Different Initial Population Sizes
### Overview
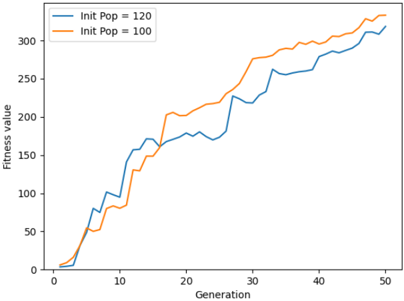
The image is a line chart comparing the performance of an evolutionary algorithm over 50 generations, using two different initial population sizes. The chart plots the "Fitness value" (y-axis) against the "Generation" (x-axis) for two data series.
### Components/Axes
* **Chart Type:** Line chart with two data series.
* **X-Axis:**
* **Label:** "Generation"
* **Scale:** Linear, from 0 to 50.
* **Major Tick Marks:** At intervals of 10 (0, 10, 20, 30, 40, 50).
* **Y-Axis:**
* **Label:** "Fitness value"
* **Scale:** Linear, from 0 to approximately 325.
* **Major Tick Marks:** At intervals of 50 (0, 50, 100, 150, 200, 250, 300).
* **Legend:**
* **Position:** Top-left corner of the chart area.
* **Series 1:** Blue line, labeled "Init Pop = 120".
* **Series 2:** Orange line, labeled "Init Pop = 100".
### Detailed Analysis
**Data Series 1: Init Pop = 120 (Blue Line)**
* **Trend:** Shows a generally upward, step-like progression with some plateaus and minor dips.
* **Key Data Points (Approximate):**
* Generation 0: Fitness ≈ 0
* Generation 5: Fitness ≈ 25
* Generation 10: Fitness ≈ 100
* Generation 15: Fitness ≈ 160
* Generation 20: Fitness ≈ 175
* Generation 25: Fitness ≈ 175 (plateau)
* Generation 30: Fitness ≈ 220
* Generation 35: Fitness ≈ 260
* Generation 40: Fitness ≈ 280
* Generation 45: Fitness ≈ 300
* Generation 50: Fitness ≈ 310
**Data Series 2: Init Pop = 100 (Orange Line)**
* **Trend:** Shows a more consistent and steeper upward trend, surpassing the blue line around generation 15 and maintaining a higher fitness value thereafter.
* **Key Data Points (Approximate):**
* Generation 0: Fitness ≈ 0
* Generation 5: Fitness ≈ 10
* Generation 10: Fitness ≈ 80
* Generation 15: Fitness ≈ 140 (crosses above blue line)
* Generation 20: Fitness ≈ 205
* Generation 25: Fitness ≈ 215
* Generation 30: Fitness ≈ 275
* Generation 35: Fitness ≈ 290
* Generation 40: Fitness ≈ 300
* Generation 45: Fitness ≈ 315
* Generation 50: Fitness ≈ 325
### Key Observations
1. **Crossover Point:** The two lines intersect near Generation 15. Before this point, the larger population (120) has a slightly higher fitness. After this point, the smaller population (100) consistently achieves a higher fitness value.
2. **Performance Gap:** By Generation 50, the fitness value for "Init Pop = 100" is approximately 15 points higher than for "Init Pop = 120".
3. **Growth Pattern:** Both series show non-linear, step-wise improvement, characteristic of evolutionary algorithms where fitness jumps occur upon discovering beneficial mutations or crossovers.
4. **Plateaus:** The blue line (Init Pop = 120) exhibits a noticeable plateau between generations 20-25, suggesting a period of stagnation in improvement.
### Interpretation
The chart demonstrates a counter-intuitive result in this specific evolutionary algorithm run: a **smaller initial population (100) ultimately yields a higher fitness solution** than a larger one (120) over 50 generations.
This could suggest several underlying dynamics:
* **Diversity vs. Convergence:** The larger population may have converged too quickly on a local optimum (evidenced by its early lead and later plateau), while the smaller population, potentially maintaining different selective pressures or experiencing more genetic drift, was able to escape that local optimum and find a better solution.
* **Computational Efficiency:** While not shown on the chart, the smaller population would require less computational resource per generation. The data indicates it also achieved a better result, making it more efficient in this case.
* **Stochastic Nature:** Evolutionary algorithms are stochastic. This single run suggests a trend, but multiple runs would be needed to confirm if this is a consistent pattern or an outlier due to random chance in the selection and mutation processes.
The key takeaway is that simply increasing the initial population size does not guarantee better performance in an evolutionary algorithm; other factors like selection pressure, mutation rate, and the fitness landscape itself play critical roles. The crossover at generation 15 is the pivotal moment where the strategy of the smaller population proved more effective for long-term optimization.