## Line Graph: Fitness Value Over Generations
### Overview
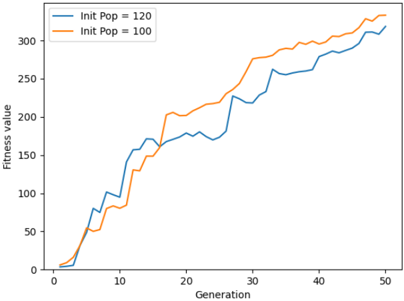
The image depicts a line graph comparing the fitness values of two populations over 50 generations. Two lines represent populations with initial sizes of 120 (blue) and 100 (orange). Both lines show an upward trend, but the blue line exhibits greater variability and a steeper increase after generation 20.
### Components/Axes
- **X-axis (Horizontal)**: Labeled "Generation," ranging from 0 to 50 in increments of 10.
- **Y-axis (Vertical)**: Labeled "Fitness value," ranging from 0 to 300 in increments of 50.
- **Legend**: Located in the top-left corner, with:
- **Blue line**: "Init Pop = 120"
- **Orange line**: "Init Pop = 100"
- **Lines**:
- **Blue line**: Starts near 0, dips below the orange line around generation 10, then rises sharply after generation 20.
- **Orange line**: Starts near 0, rises steadily, and remains above the blue line until generation 20, after which it plateaus slightly.
### Detailed Analysis
- **Blue Line (Init Pop = 120)**:
- **Generations 0–10**: Fitness value rises from ~0 to ~100, with fluctuations (e.g., ~50 at generation 5, ~150 at generation 10).
- **Generations 10–20**: Dips to ~120 at generation 15, then rises to ~180 by generation 20.
- **Generations 20–50**: Accelerates sharply, reaching ~300 by generation 50.
- **Orange Line (Init Pop = 100)**:
- **Generations 0–10**: Rises from ~0 to ~80, with minor fluctuations.
- **Generations 10–20**: Steady increase to ~200 by generation 20.
- **Generations 20–50**: Slows slightly, reaching ~310 by generation 50.
### Key Observations
1. **Crossover Point**: The blue line (Init Pop = 120) surpasses the orange line (Init Pop = 100) around generation 20, despite starting lower.
2. **Volatility**: The blue line shows more pronounced fluctuations (e.g., dips at generations 5, 15) compared to the smoother orange line.
3. **Final Values**: Both lines converge near 300 by generation 50, but the blue line ends slightly higher (~310 vs. ~300).
### Interpretation
The graph suggests that larger initial population sizes (120 vs. 100) may lead to higher long-term fitness values, even if short-term performance is less stable. The blue line’s initial dip and subsequent surge could indicate adaptive mechanisms (e.g., genetic diversity, selection pressure) that favor larger populations over time. The orange line’s steady rise implies that smaller populations might achieve consistent but slower growth. The crossover at generation 20 highlights the importance of population size in evolutionary dynamics, where larger groups may recover from early setbacks to outperform smaller ones in the long run.