## Line Graphs: Model Performance Comparison (L2 and H1 Error Squared)
### Overview
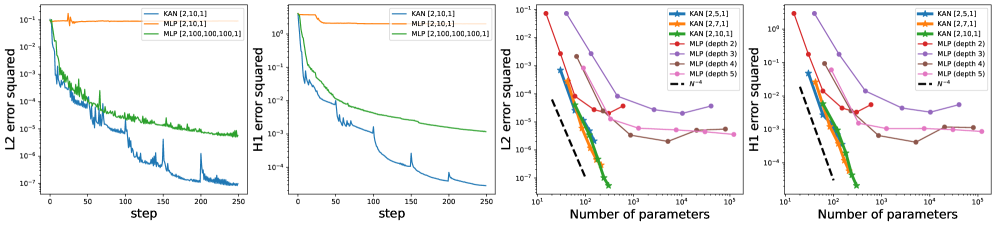
The image contains four line graphs comparing the performance of KAN (Kernel Approximate Neural Networks) and MLP (Multilayer Perceptron) models across different configurations. The graphs track **L2 error squared** and **H1 error squared** as functions of **training steps** (left graphs) and **number of parameters** (right graphs). Models are differentiated by architecture (KAN vs. MLP) and depth (e.g., MLP depth 2, 3, 4, 5).
---
### Components/Axes
#### Left Graphs (Training Steps)
- **X-axis**: "step" (0 to 250, linear scale)
- **Y-axis**:
- Top-left: "L2 error squared" (10⁻¹ to 10⁻⁷, log scale)
- Bottom-left: "H1 error squared" (10⁰ to 10⁻⁴, log scale)
- **Legends**:
- **Top-left**:
- Blue: KAN [2,10,1]
- Orange: MLP [2,10,1]
- Green: MLP [2,100,100,100,1]
- **Bottom-left**: Same legend as top-left.
#### Right Graphs (Number of Parameters)
- **X-axis**: "Number of parameters" (10¹ to 10³, log scale)
- **Y-axis**:
- Top-right: "L2 error squared" (10⁰ to 10⁻⁶, log scale)
- Bottom-right: "H1 error squared" (10⁰ to 10⁻⁴, log scale)
- **Legends**:
- **Top-right**:
- Blue: KAN [2,5,1]
- Orange: KAN [2,7,1]
- Green: KAN [2,10,1]
- Red: MLP (depth 2)
- Brown: MLP (depth 4)
- Pink: MLP (depth 5)
- Black dashed: N⁻⁴ (theoretical baseline)
- **Bottom-right**: Same legend as top-right.
---
### Detailed Analysis
#### Left Graphs (Training Steps)
1. **L2 Error Squared**:
- **KAN [2,10,1] (blue)**: Starts at ~10⁻¹, drops sharply to ~10⁻³ by step 50, then stabilizes near ~10⁻⁶ by step 250.
- **MLP [2,10,1] (orange)**: Remains flat at ~10⁻¹ throughout.
- **MLP [2,100,100,100,1] (green)**: Decreases gradually from ~10⁻¹ to ~10⁻⁴ by step 250.
2. **H1 Error Squared**:
- **KAN [2,10,1] (blue)**: Starts at ~10⁰, drops to ~10⁻³ by step 50, then stabilizes near ~10⁻⁴ by step 250.
- **MLP [2,10,1] (orange)**: Remains flat at ~10⁻¹.
- **MLP [2,100,100,100,1] (green)**: Decreases from ~10⁻¹ to ~10⁻³ by step 250.
#### Right Graphs (Number of Parameters)
1. **L2 Error Squared**:
- **KAN models**:
- Depth 2 (blue): ~10⁻¹ at 10¹ parameters, ~10⁻³ at 10² parameters, ~10⁻⁵ at 10³ parameters.
- Depth 3 (orange): ~10⁻² at 10¹ parameters, ~10⁻⁴ at 10² parameters, ~10⁻⁶ at 10³ parameters.
- Depth 10 (green): ~10⁻³ at 10¹ parameters, ~10⁻⁵ at 10² parameters, ~10⁻⁷ at 10³ parameters.
- **MLP models**:
- Depth 2 (red): ~10⁻¹ at 10¹ parameters, ~10⁻³ at 10² parameters, ~10⁻⁵ at 10³ parameters.
- Depth 4 (brown): ~10⁻² at 10¹ parameters, ~10⁻⁴ at 10² parameters, ~10⁻⁶ at 10³ parameters.
- Depth 5 (pink): ~10⁻³ at 10¹ parameters, ~10⁻⁵ at 10² parameters, ~10⁻⁷ at 10³ parameters.
- **Baseline (black dashed)**: N⁻⁴ (e.g., ~10⁻⁴ at 10³ parameters).
2. **H1 Error Squared**:
- **KAN models**:
- Depth 2 (blue): ~10⁰ at 10¹ parameters, ~10⁻² at 10² parameters, ~10⁻⁴ at 10³ parameters.
- Depth 3 (orange): ~10⁻¹ at 10¹ parameters, ~10⁻³ at 10² parameters, ~10⁻⁵ at 10³ parameters.
- Depth 10 (green): ~10⁻² at 10¹ parameters, ~10⁻⁴ at 10² parameters, ~10⁻⁶ at 10³ parameters.
- **MLP models**:
- Depth 2 (red): ~10⁰ at 10¹ parameters, ~10⁻² at 10² parameters, ~10⁻⁴ at 10³ parameters.
- Depth 4 (brown): ~10⁻¹ at 10¹ parameters, ~10⁻³ at 10² parameters, ~10⁻⁵ at 10³ parameters.
- Depth 5 (pink): ~10⁻² at 10¹ parameters, ~10⁻⁴ at 10² parameters, ~10⁻⁶ at 10³ parameters.
- **Baseline (black dashed)**: N⁻⁴ (e.g., ~10⁻⁴ at 10³ parameters).
---
### Key Observations
1. **KAN vs. MLP Performance**:
- KAN models consistently outperform MLPs across all depths and parameter counts.
- KAN [2,10,1] achieves the lowest L2 error (~10⁻⁷) with 10³ parameters, while MLP depth 5 (best MLP) reaches ~10⁻⁵.
- KAN models require fewer parameters to achieve comparable error rates (e.g., KAN depth 10 at 10² parameters matches MLP depth 5 at 10³ parameters).
2. **Error Trends**:
- Errors decrease exponentially with increasing parameters for all models.
- KAN models exhibit steeper error reduction curves than MLPs, especially at lower parameter counts.
3. **Anomalies**:
- MLP [2,10,1] (orange) shows no improvement over training steps, suggesting poor convergence.
- KAN [2,10,1] (blue) in the left graphs has a sharp initial drop, indicating rapid learning.
---
### Interpretation
The data demonstrates that **KAN models are more parameter-efficient and accurate than MLPs** for the same task. Key insights:
- **Architectural Advantage**: KAN’s kernel-based design allows it to achieve lower errors with fewer parameters compared to MLPs, which require deeper architectures (e.g., depth 5) to match KAN’s performance.
- **Scalability**: Both models improve with more parameters, but KAN’s gains are more pronounced. For example, KAN depth 10 at 10² parameters outperforms MLP depth 5 at 10³ parameters.
- **Convergence Behavior**: The flat performance of MLP [2,10,1] highlights the importance of model depth and architecture in training dynamics.
These results suggest that KAN is a promising alternative to traditional MLPs for tasks requiring high accuracy with limited computational resources.