## Image Analysis: Scene Understanding and Reasoning
### Overview
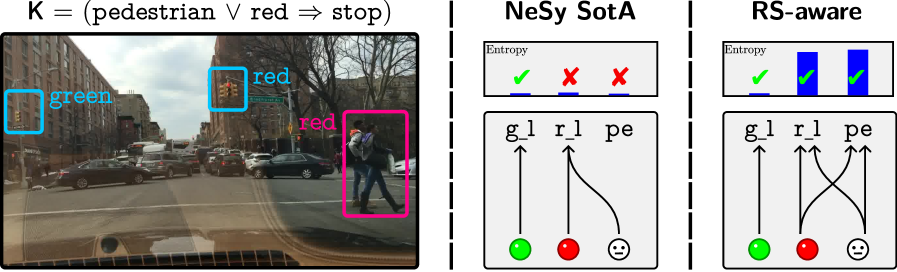
The image presents a scene understanding and reasoning comparison between two approaches: "NeSy SotA" and "RS-aware". The image is divided into three sections. The left section shows a street scene with bounding boxes around objects, and an associated logical rule. The middle and right sections are diagrams representing the reasoning process of the two approaches, including entropy visualizations and connections between ground-level perceptions and higher-level concepts.
### Components/Axes
**Left Section (Street Scene):**
* **Image:** A photograph of a street scene with cars, buildings, traffic lights, and pedestrians.
* **Bounding Boxes:**
* A cyan box around a green traffic light, labeled "green".
* A cyan box around a red traffic light, labeled "red".
* A magenta box around two pedestrians, labeled "red".
* **Logical Rule:** "K = (pedestrian ∨ red ⇒ stop)"
**Middle Section (NeSy SotA):**
* **Title:** "NeSy SotA"
* **Entropy Visualization:** A horizontal bar with three segments.
* First segment: A green checkmark.
* Second segment: A red "X".
* Third segment: A red "X".
* Label: "Entropy" above the bar.
* **Diagram:**
* Labels: "g_l", "r_l", "pe" (likely representing green light, red light, and pedestrian, respectively)
* Nodes: Green circle, red circle, and a smiley face icon.
* Arrows: An arrow from the green circle to "g_l", an arrow from the red circle to "r_l", and a curved arrow from the smiley face to "r_l".
**Right Section (RS-aware):**
* **Title:** "RS-aware"
* **Entropy Visualization:** A horizontal bar with three segments.
* First segment: A green checkmark.
* Second segment: A blue bar.
* Third segment: A blue bar.
* Label: "Entropy" above the bar.
* **Diagram:**
* Labels: "g_l", "r_l", "pe"
* Nodes: Green circle, red circle, and a smiley face icon.
* Arrows: An arrow from the green circle to "g_l", an arrow from the red circle to "r_l", and two crossing arrows, one from the smiley face to "r_l" and one from the red circle to "pe".
### Detailed Analysis or Content Details
**Left Section (Street Scene):**
* The street scene depicts a typical urban environment with traffic and pedestrians.
* The bounding boxes highlight the objects of interest for the reasoning task: traffic lights and pedestrians.
* The logical rule "K = (pedestrian ∨ red ⇒ stop)" states that the system should stop if there are pedestrians or the traffic light is red.
**Middle Section (NeSy SotA):**
* The entropy visualization shows a green checkmark for the first segment and red "X"s for the second and third segments. This suggests that the system correctly identifies the green light but fails to correctly identify the red light and pedestrian.
* The diagram shows that the green light is correctly associated with "g_l", the red light is correctly associated with "r_l", but the pedestrian is incorrectly associated with "r_l" instead of "pe".
**Right Section (RS-aware):**
* The entropy visualization shows a green checkmark for the first segment and blue bars for the second and third segments. This suggests that the system correctly identifies the green light and also identifies the red light and pedestrian.
* The diagram shows that the green light is correctly associated with "g_l", the red light is correctly associated with "r_l", and the pedestrian is correctly associated with "pe".
### Key Observations
* The image compares the performance of two scene understanding and reasoning approaches.
* "NeSy SotA" struggles to correctly identify the red light and pedestrian, while "RS-aware" performs better.
* The entropy visualizations provide a measure of uncertainty for each approach.
* The diagrams illustrate the connections between ground-level perceptions and higher-level concepts.
### Interpretation
The image demonstrates the importance of robust scene understanding and reasoning for autonomous systems. The "NeSy SotA" approach, while being state-of-the-art, fails to correctly identify the red light and pedestrian, which could lead to dangerous situations. The "RS-aware" approach, on the other hand, performs better by correctly identifying the objects of interest and associating them with the appropriate concepts. This suggests that "RS-aware" is a more reliable approach for scene understanding and reasoning in this scenario. The logical rule "K = (pedestrian ∨ red ⇒ stop)" highlights the importance of safety in autonomous systems, as the system should stop if there are pedestrians or the traffic light is red.