## Diagram: Traffic Scene Analysis with Uncertainty Quantification
### Overview
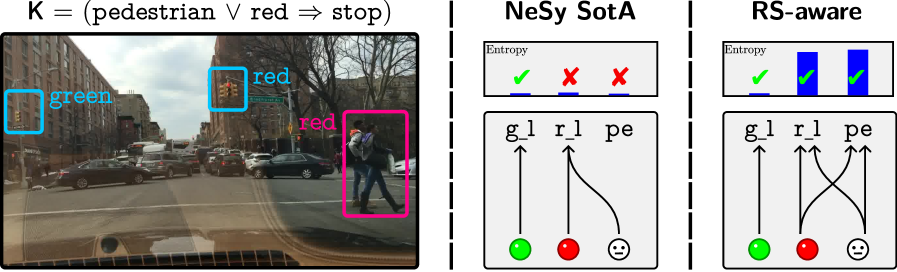
The image presents a comparison of two approaches – NeSy (State-of-the-Art) and RS-aware – for analyzing a traffic scene, focusing on uncertainty quantification related to pedestrian detection and traffic light recognition. The left side shows a real-world street scene with bounding boxes around detected objects. The right two sections illustrate the uncertainty representation for each approach using diagrams.
### Components/Axes
The image is divided into three main sections:
1. **Real-World Scene:** A photograph of a street with cars, pedestrians, and traffic lights. Bounding boxes with labels are overlaid on the image.
2. **NeSy SOTA:** A diagram representing the uncertainty quantification of the NeSy approach. It includes a visual representation of entropy and a directed graph.
3. **RS-aware:** A diagram representing the uncertainty quantification of the RS-aware approach, similar in structure to the NeSy diagram.
The diagrams share the following components:
* **Entropy:** Represented by a bar graph.
* **Nodes:** Representing 'gl' (green light), 'rl' (red light), and 'pe' (pedestrian).
* **Edges:** Representing relationships between the nodes, with arrows indicating direction.
* **Node Indicators:** Green checkmarks and red crosses indicate confidence levels.
### Detailed Analysis or Content Details
**Real-World Scene:**
* A bounding box labeled "green" (blue outline) surrounds a traffic light displaying a green signal.
* Two bounding boxes labeled "red" (cyan outline) surround traffic lights displaying a red signal.
* A bounding box labeled "red" (magenta outline) surrounds a pedestrian.
* The equation at the top reads: K = (pedestrian ∨ red ⇒ stop). This suggests a rule-based system where the system should stop if a pedestrian or a red light is detected.
**NeSy SOTA:**
* **Entropy:** The bar graph shows two bars. The first bar (corresponding to the green light) is short and marked with a green checkmark. The second bar (corresponding to the red light) is long and marked with a red cross.
* **Directed Graph:**
* 'gl' (green light) node is connected to 'pe' (pedestrian) with a red line and a sad face.
* 'rl' (red light) node is connected to 'pe' (pedestrian) with a red line and a sad face.
* 'gl' (green light) node has an upward arrow.
* 'rl' (red light) node has an upward arrow.
* 'pe' (pedestrian) node has an upward arrow.
**RS-aware:**
* **Entropy:** The bar graph shows two bars. The first bar (corresponding to the green light) is tall and marked with a green checkmark. The second bar (corresponding to the red light) is short and marked with a green checkmark.
* **Directed Graph:**
* 'gl' (green light) node is connected to 'pe' (pedestrian) with a black line and a neutral face.
* 'rl' (red light) node is connected to 'pe' (pedestrian) with a black line and a neutral face.
* 'gl' (green light) node has an upward arrow.
* 'rl' (red light) node has an upward arrow.
* 'pe' (pedestrian) node has an upward arrow.
### Key Observations
* The NeSy approach indicates high uncertainty regarding the red light (long red bar and red cross) and a negative correlation between the green light and pedestrian detection (red line and sad face).
* The RS-aware approach indicates low uncertainty for both the green and red lights (short green bars and green checkmarks) and a neutral correlation between the lights and pedestrian detection (black lines and neutral faces).
* The entropy bars in RS-aware are inverted compared to NeSy.
* The RS-aware approach appears to provide a more consistent and confident assessment of the scene.
### Interpretation
The image demonstrates a comparison between two methods for assessing uncertainty in a traffic scene. The NeSy approach seems to struggle with accurately identifying the red light, leading to high uncertainty. The RS-aware approach, on the other hand, provides a more confident and consistent assessment of both traffic lights. The directed graphs illustrate the relationships between the detected objects and the level of confidence in those detections. The use of checkmarks, crosses, and neutral faces provides a quick visual indication of the system's confidence. The equation at the top suggests that the system is designed to stop when a pedestrian or red light is detected, and the diagrams illustrate how each approach quantifies the uncertainty associated with these detections. The RS-aware approach appears to be more robust and reliable in this scenario. The difference in entropy values and the direction of the lines in the graphs suggest that the RS-aware method is better at resolving ambiguities and providing a more accurate representation of the scene.